Kubernetes monitoring means collecting health, performance, and resource data from every layer of a cluster, from the control plane down to the individual containers running your workloads. It needs its own discipline because Kubernetes never holds still. A pod that existed five minutes ago might be gone now, rescheduled onto a different node under a different IP, and the metrics you were collecting against it are suddenly pointing at nothing.
This article covers why monitoring Kubernetes is different from monitoring a fleet of static servers, how the data gets collected, which metrics are worth alerting on, and the failure modes that catch teams out once they're past the demo cluster.
Why monitoring Kubernetes matters
On a traditional server, a process has a stable home. It runs on a known host, keeps the same address, and stays there until someone restarts it. You point a monitoring agent at the host and you're done. Kubernetes throws all of that out. The scheduler places pods wherever there's capacity, the horizontal pod autoscaler spins replicas up and down based on load, and a node failure reshuffles everything onto whatever else is available. Identity is no longer tied to a machine.
That movement is the whole point of Kubernetes, but it's also why a blind cluster fails in ways that are expensive and miserable to trace after the fact. Set a memory limit slightly too low and a container gets OOMKilled and restarted; without monitoring you just see intermittent latency with no obvious cause. A misconfigured readiness probe pulls a pod out of the load-balancer rotation while it still reports as healthy to kubectl. A deployment quietly fails to schedule because the cluster is out of allocatable CPU, and the only sign is replicas stuck in Pending.
So monitoring buys you a few concrete things. You catch resource pressure before it cascades into evictions. You get real numbers to right-size requests and limits instead of guessing. And when an incident starts, you have the history to answer "what changed?" — which, in a system this dynamic, is rarely the thing you were already looking at. That last one is usually the difference between a five-minute fix and an hour of flailing.
How Kubernetes monitoring works
Kubernetes exposes metrics from its components, but it deliberately doesn't ship a system to store, query, or alert on them. The control plane components (the API server, scheduler, controller manager, and etcd) each expose a Prometheus-format /metrics endpoint, and that's about where the built-in story ends. Everything else you assemble from a handful of standard pieces, and it's worth knowing each one by name because nearly every setup is some combination of them.
cAdvisor is the one you get for free. It's baked into the kubelet on every node and collects per-container resource usage: CPU, memory, filesystem, and network. Since it ships inside the kubelet, that container-level data is sitting at the kubelet's /metrics/cadvisor endpoint with nothing extra to install.
Metrics Server sits one level up. It scrapes the kubelet on each node and aggregates live CPU and memory usage into the Metrics API, which is what powers kubectl top and what the horizontal pod autoscaler reads to make scaling decisions. The catch is that it keeps only the latest values in memory, with no history. It can tell you what's using resources right now and nothing about five minutes ago.
kube-state-metrics does something different. Instead of resource usage, it generates metrics about the state of Kubernetes objects, derived straight from the API server: how many replicas a deployment wants versus how many are ready, which pods are wedged in Pending or CrashLoopBackOff, whether a node is cordoned. Metrics like kube_pod_container_status_restarts_total and kube_deployment_status_replicas_unavailable come from here, and they're often the ones that tell you something is genuinely broken rather than just busy.
Then Prometheus ties it together for most teams. It scrapes the endpoints above on an interval, stores everything as time-series data, and lets you query it with PromQL and alert through Alertmanager. The kube-prometheus-stack Helm chart wires up Prometheus, the standard exporters, and a set of dashboards in one install, which is why so many clusters end up running it.
Metrics alone won't get you all the way, though. They tell you a pod is restarting; the logs from that pod tell you it's failing to reach a database; a distributed trace shows you the request path that's timing out as a result. OpenTelemetry has become the vendor-neutral standard for collecting all three, and the OpenTelemetry Collector can scrape Prometheus endpoints and gather logs and traces in a single agent.
Key metrics and what they tell you
Kubernetes emits a staggering number of metrics, and the mistake is treating them as equally important. A workable setup watches a handful per layer, picked because crossing a threshold means something you can actually act on.
Start at the cluster and control plane. The numbers that matter here are node count and node readiness, the ratio of requested to allocatable CPU and memory, and API server request latency. The resource ratios tell you whether you can still schedule new pods or are about to start evicting them; once requests approach allocatable capacity, the next deployment simply won't fit. API server latency matters because every scheduling decision and every kubectl command flows through it, so when it climbs, the whole cluster feels sluggish.
Node-level signals look more like traditional infrastructure: CPU and memory pressure, disk I/O, available disk space, network throughput. The Kubernetes-specific twist is the eviction threshold. When a node runs low on memory or disk, the kubelet starts evicting pods to claw resources back, and those evictions look random until you line them up against node pressure.
Pods and containers are where the metrics get specific to your workloads. The ones that earn their place are CPU and memory usage measured against the configured requests and limits, container restart counts, and pod phase. Usage-against-limit is the one to watch most closely. A container sitting at 95% of its memory limit is one traffic spike away from being OOMKilled, and the restart that follows is the symptom you'll see, not the cause. A climbing restart count is your earliest warning of a CrashLoopBackOff, usually before it turns into a user-facing outage.
For the applications themselves, the useful frame is request rate, error rate, and duration, the three signals of the RED method. These tell you whether your services are serving users well, which is the point of all the infrastructure metrics underneath. A cluster can look perfectly healthy at the node level while an app inside it returns errors on every third request.
Kubernetes monitoring challenges
The hardest parts of Kubernetes monitoring are mostly fallout from the same dynamism that makes it necessary.
Cardinality is the one that bites teams financially. Pods come and go, and each one carries a unique identity, so the labels attached to your metrics multiply fast. A deployment that churns through hundreds of pods over a day produces hundreds of distinct time series for what is conceptually one workload. That high cardinality is the single biggest driver of storage cost and slow queries, and it's why naive setups get expensive in a hurry. You can aggregate at the workload level instead of tracking individual pods forever, but you have to design for it on purpose, not discover the bill later.
Then there's the fragmentation. The standard stack is genuinely several separate tools: Metrics Server for live usage, kube-state-metrics for object state, cAdvisor for containers, Prometheus for storage, a dashboarding layer on top, and a whole other pipeline for logs and traces. Each speaks a slightly different dialect, and diagnosing one incident often means hopping between dashboards and query languages to piece a single timeline together. The data exists. The friction is in correlating it while production is on fire.
Operational overhead is the cost that scales with your cluster count. Running this stack means configuring, scaling, securing, and upgrading the monitoring components themselves, and that work grows with every cluster you add. Metric names and formats also drift between Kubernetes versions, so a dashboard or alert that worked fine on one version can break quietly on the next when a metric gets renamed or dropped. Teams running a fleet spend real engineering time just keeping the monitoring consistent across all of it.
The subtlest one is alert noise. It's easy to wire up alerts on every metric the stack emits, and what you get is a firehose of notifications that engineers quickly learn to tune out, which defeats the entire purpose. Good Kubernetes monitoring is as much about restraint as coverage: alert on the symptoms that need a human, like replicas staying unavailable or memory holding near the limit, not on every transient blip that heals itself before anyone reads the page.
Final thoughts
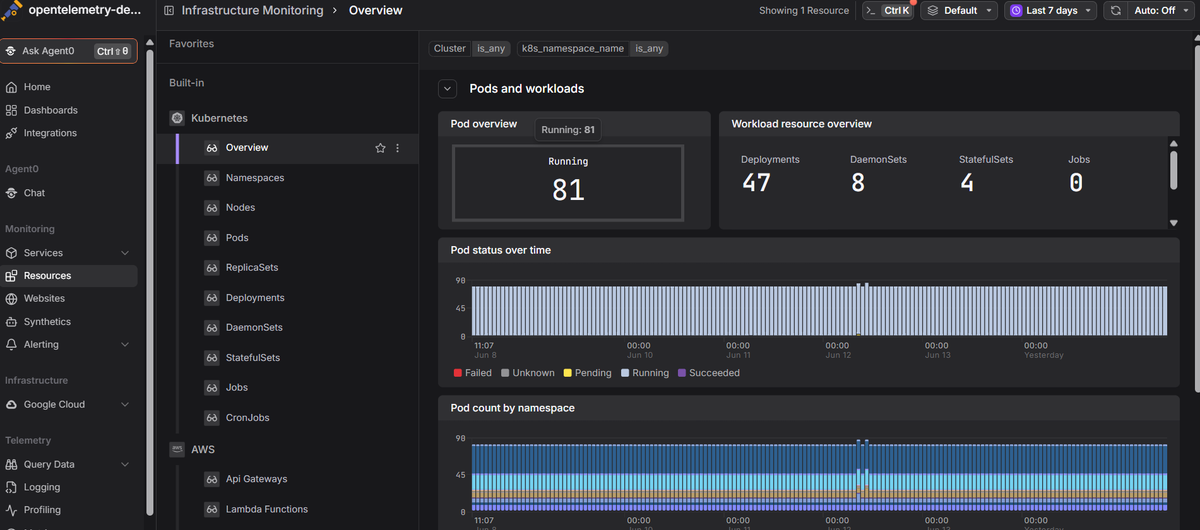
Once the fundamentals are collecting, the goal is a single place where cluster health, resource pressure, pod state, logs, and traces line up against the same timeline, so that answering "what changed?" doesn't mean opening six tabs.
Dash0's Kubernetes monitoring is OpenTelemetry-native and surfaces cluster and node health alongside resource metrics, pod state, real-time logs, and distributed traces in one view, so you can diagnose issues without stitching tools together by hand.
 Start a free trial to see your cluster metrics, logs, and traces in one place. No credit card required.