
Last updated:
What Is Agentic Observability?
"Agentic observability" gets used for two different things, and the ambiguity causes more confusion than almost any other term in this space right now. One meaning is observing AI agents: capturing the reasoning steps, tool calls, and decision branches of an autonomous agent so you can debug it when it goes wrong. The other meaning is observability that is itself agentic, where AI agents do the observing, investigating incidents and drafting fixes instead of a human squinting at a dashboard.
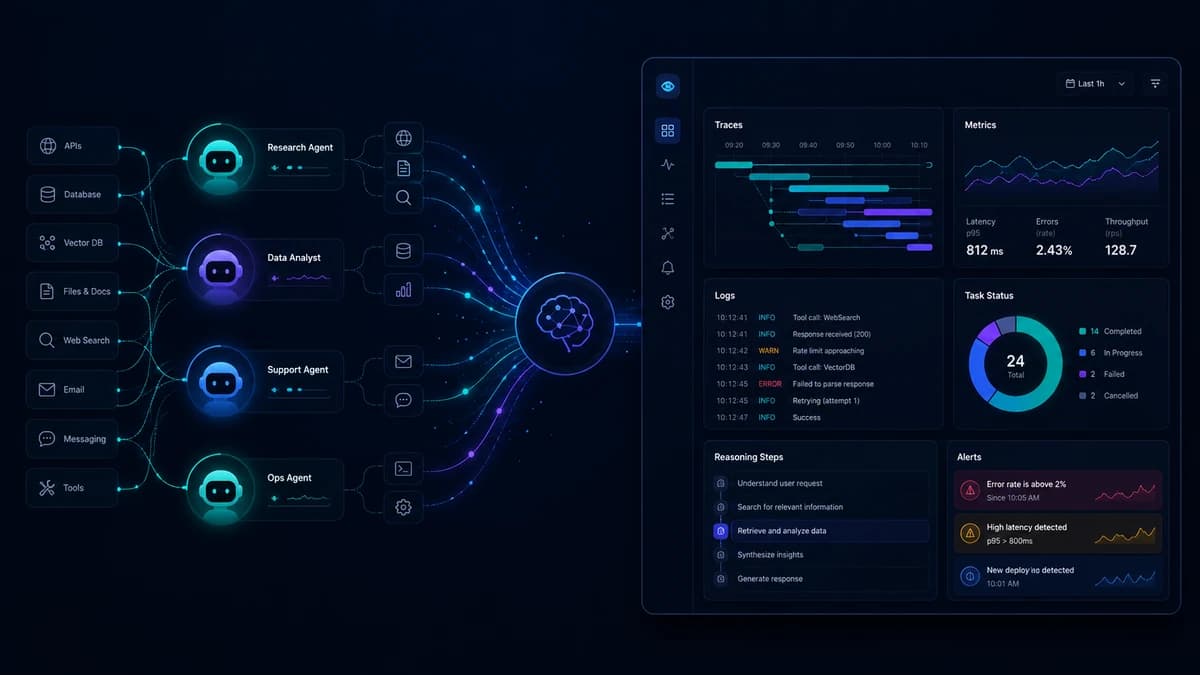 Both are real, and they describe opposite ends of the same shift. This article separates the two, explains what each one requires, and shows how they connect. If you're trying to understand how agent observability fits into the wider picture of monitoring AI systems, start with what is AI observability, which frames the full stack. This article zooms in on the agentic parts and the terminology trap around them. For the wider vocabulary of AI agents in production, the agentic software engineering terminology reference is a useful companion.
The two meanings, kept separate
The cleanest way to hold these apart is to ask which side of the telemetry the agent sits on.
In the first meaning, the agent is the subject. You are observing an AI agent the way you'd observe any other production workload, except the failure modes are stranger. The agent plans, retrieves context, calls tools, feeds results back into a model, and loops until it decides it's finished. Your job is to reconstruct that run after the fact: which tool ran with which arguments, which reasoning branch it took, where the run derailed. This is a monitoring problem.
In the second meaning, the agent is the observer. Instead of a person reading traces and running playbooks, an AI agent reads your telemetry, correlates signals, follows the problem into your code, and proposes a fix. This is an automation problem, and it's the direction the whole category is moving as AI-generated code outpaces the humans who used to review and operate it.
The two are related in practice. The better your agents are instrumented (meaning one), the better an observing agent (meaning two) can reason about them. But they are not the same discipline, and conflating them leads to buying the wrong tool for the problem you actually have.
Observing AI agents: what breaks and what to capture
Agent failures don't look like traditional failures. A conventional service tells you it's broken with an error code, a latency spike, or a saturation alert. An agent can return HTTP 200, keep every dashboard green, and still be completely wrong, because it hallucinated a tool call, followed flawed reasoning, or looped without converging. This is the failure mode that catches teams off guard: silent success, where the operational metrics look healthy while the decision quality quietly degrades.
The reason traditional monitoring can't catch this is that agent execution is non-deterministic. There's no single pre-programmed path to alert on. The agent might reflect, pick from several tools, query an external system, and revise its plan based on what it gets back. Two identical requests can take entirely different routes. Monitoring built to track deterministic operations tells you whether something ran, not why the agent chose the action it did.
So the signals you capture shift toward the agent's control flow. You want the full execution tree as a single trace with a span per step: the prompt and the response at each hop, the retrieved context and its source, tool invocations with their arguments and results, the decision branches taken, and where token cost accumulates. A coherent agent run only makes sense when you can see all of that in one place, which is why distributed tracing becomes load-bearing here rather than optional.
The tempting mistake is to reach for a separate AI-specific tool that captures prompts and token counts in its own proprietary schema, sitting beside the observability stack you already run. The moment an agent run touches a database and a downstream service (which is most runs) you're correlating across two systems by hand. OpenTelemetry avoids that. Its GenAI semantic conventions, in development since 2024, standardize agent telemetry under the gen_ai.* namespace, so agent and tool spans land in the same trace as the HTTP request, the SQL query, and the cache lookup around them. Agent and tool steps set gen_ai.operation.name to values like invoke_agent or execute_tool, and a model call carries attributes such as gen_ai.request.model and gen_ai.usage.input_tokens.
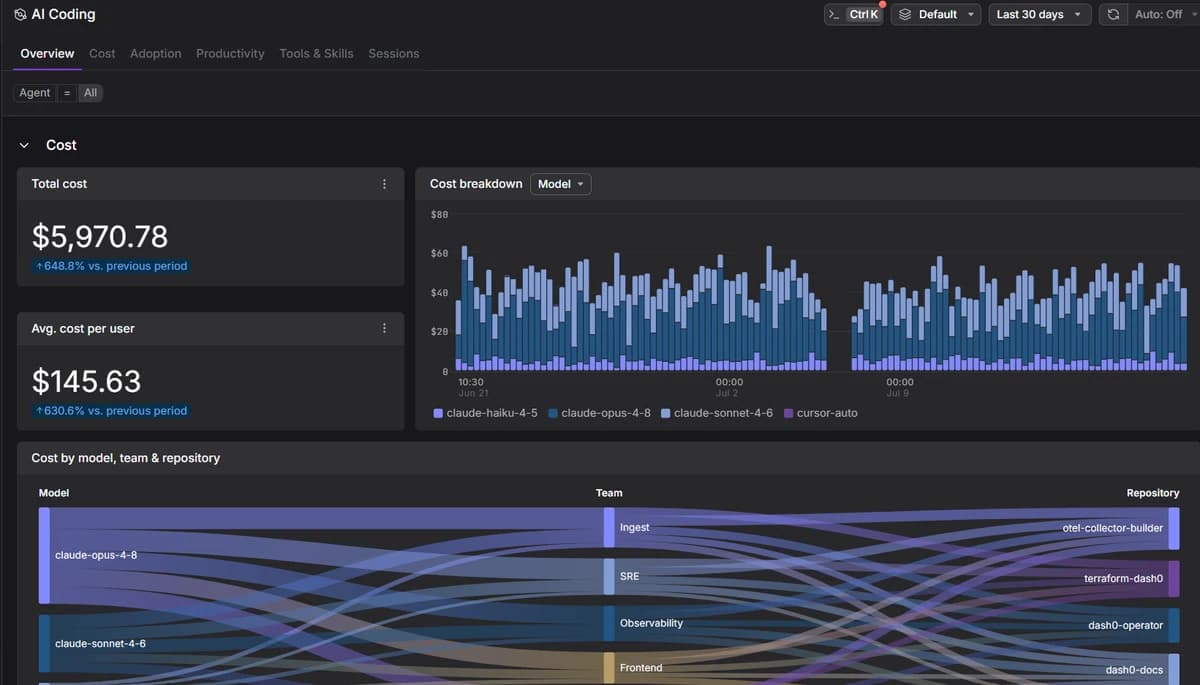
This is also the meaning that applies to the coding agents writing your software, not just the agents inside your product. When Claude Code or Cursor runs, each session is an agent run with the same shape: prompts, tool calls, MCP invocations, token cost, and failures. Dash0's AI Coding Insights captures exactly that through an open-source OpenTelemetry plugin, so a coding session arrives as standard gen_ai.* and vcs.* traces over OTLP rather than in a proprietary schema. You get one row per session, sortable by cost, turns, or error count, and can replay the full conversation to see which runs did real work and which ran in circles. It's the same instrumentation discipline described above, pointed at the agents that build your code.
One caveat before you trust the data: the GenAI conventions are still in development as of mid-2026, and many instrumentation libraries emit attribute names from older spec revisions. Check what version your library produces before you build queries on top of it.
Observability that is agentic: agents as the observer
The other meaning flips the arrangement. Here the agent isn't the thing being watched. It's the thing doing the watching.
This exists because the economics of running production have broken. Coding agents turned specs into pull requests and pull requests into deployments, so the front half of the software lifecycle now moves at machine speed. The back half, reasoning about what shipped and finding what broke and fixing it, still lands on human engineers reading dashboards one at a time. When you deploy ten times more often, the operational work grows with it, and dashboards and alerts all quietly assume a person is on the other end with time to read them. That assumption is what agentic observability, in this sense, is built to remove.
The strain shows up on both sides of the deploy. The Faros AI Engineering Report 2026, covering 22,000 developers across 4,000 teams, puts task throughput per developer up 34% and code-related tasks per team up 210%. The same teams over the same period saw incidents per pull request rise 243%, median time in review rise 442%, lead time to production rise 480%, and pull requests merged without any review rise 31%. Faros calls the pattern the Acceleration Whiplash, and its own conclusion is that no amount of engineering maturity exempts you from it. Faster shipping, more incidents, and a review process that quietly stops happening. That pattern is why the fix has two halves, upstream and downstream, and Dash0 addresses each with a distinct product.
Upstream, before code ever reaches production, is Darkplane: the control room for what your coding agents produce. Today it ties every dollar of token spend to the pull requests it created and measures adoption and productivity per tool and per team. AutoMerge and the Context Graph are the pieces still to come. AutoMerge is an approval agent rather than a reviewer: it reads the signals your existing review tools already produce, merges the safe low-stakes changes on its own, and routes risky ones to a human, so human attention lands where it changes the outcome. Darkplane's argument is that the cheapest place to fix an incident is upstream, where the code is written and reviewed, not after it breaks.
Downstream, once code is running, is Agent0. It takes a question ("what's wrong with the checkout service?"), pulls the relevant telemetry, correlates signals across traces, logs, and metrics, follows the problem into the code through a source integration, and drafts the fix as a pull request you review. It's a standalone autonomous production AI made up of specialized agents rather than a single chatbot: the Seeker, the Oracle, the Pathfinder, the Threadweaver, and the Artist, each with a distinct role. Agent0 reads OpenTelemetry data natively and runs in a sandboxed environment that can clone repositories and execute multi-step investigations. The design deliberately keeps every tool call inspectable, so you can click into exactly which data the agent operated on rather than trusting an opaque conclusion. The practical guide to agentic observability in Dash0 walks through what this looks like against real telemetry.
The important constraint is trust, and it's why Agent0 works through progressive autonomy rather than switching on full automation. It starts with the agent proposing and a human approving, moves to the system acting while a human reviews, and only later reaches the point where it runs on its own for a given class of task. The realistic model isn't full autonomy on day one. It's an agent that does the tedious correlation work and hands you a reviewable artifact, so you keep the decision.
Why the two meanings keep colliding
The overlap is genuine, which is why the term stays muddled. An observing agent needs well-instrumented agents to reason about, and instrumenting your agents well makes them legible to an observing agent. The same OpenTelemetry data serves both: the traces you capture to debug an agent by hand are the traces an AI agent reads to debug it for you.
The practical takeaway is to notice which problem you're solving. If you're shipping an AI product and users are getting wrong answers, you need meaning one: instrumentation that captures agent reasoning and tool calls so you can see where a run went off the rails. If your engineers are drowning in incidents from code that ships faster than they can operate it, you're looking at meaning two, on both sides of the deploy: Darkplane upstream to see what the coding agents build and catch it before it ships, Agent0 downstream to investigate and act on what's already running. Most teams building on AI eventually need all of it, sitting on the same telemetry pipeline.
Final thoughts
Agentic observability isn't a separate stack to bolt on. In both meanings it's an extension of the observability you already run, applied to the parts of a system that traditional tooling never had to reason about: non-deterministic execution paths on one side, and human operators as a bottleneck on the other. The common foundation is OpenTelemetry data that captures enough span-level context to reconstruct any individual run after the fact, whether that run is a coding agent opening a pull request or a production service handling a request.
Dash0 is an OpenTelemetry-native observability platform that ingests AI agent telemetry through the same pipeline as your infrastructure metrics, logs, and distributed traces, so you can follow a request from a user's thumbs-down click through an agent's decision graph to the GPU it ran on, in one view. On top of that pipeline, Darkplane watches what your coding agents build (cost, adoption, review quality, and production impact) before it ships, and Agent0 investigates what's already running and drafts fixes, with human review at each step until you're confident enough to let it run further on its own.
 Start a free trial to see your agent traces, token usage, and tool-call spans alongside the rest of your stack. No credit card required.
