Last updated: June 15, 2026
Explore Resources
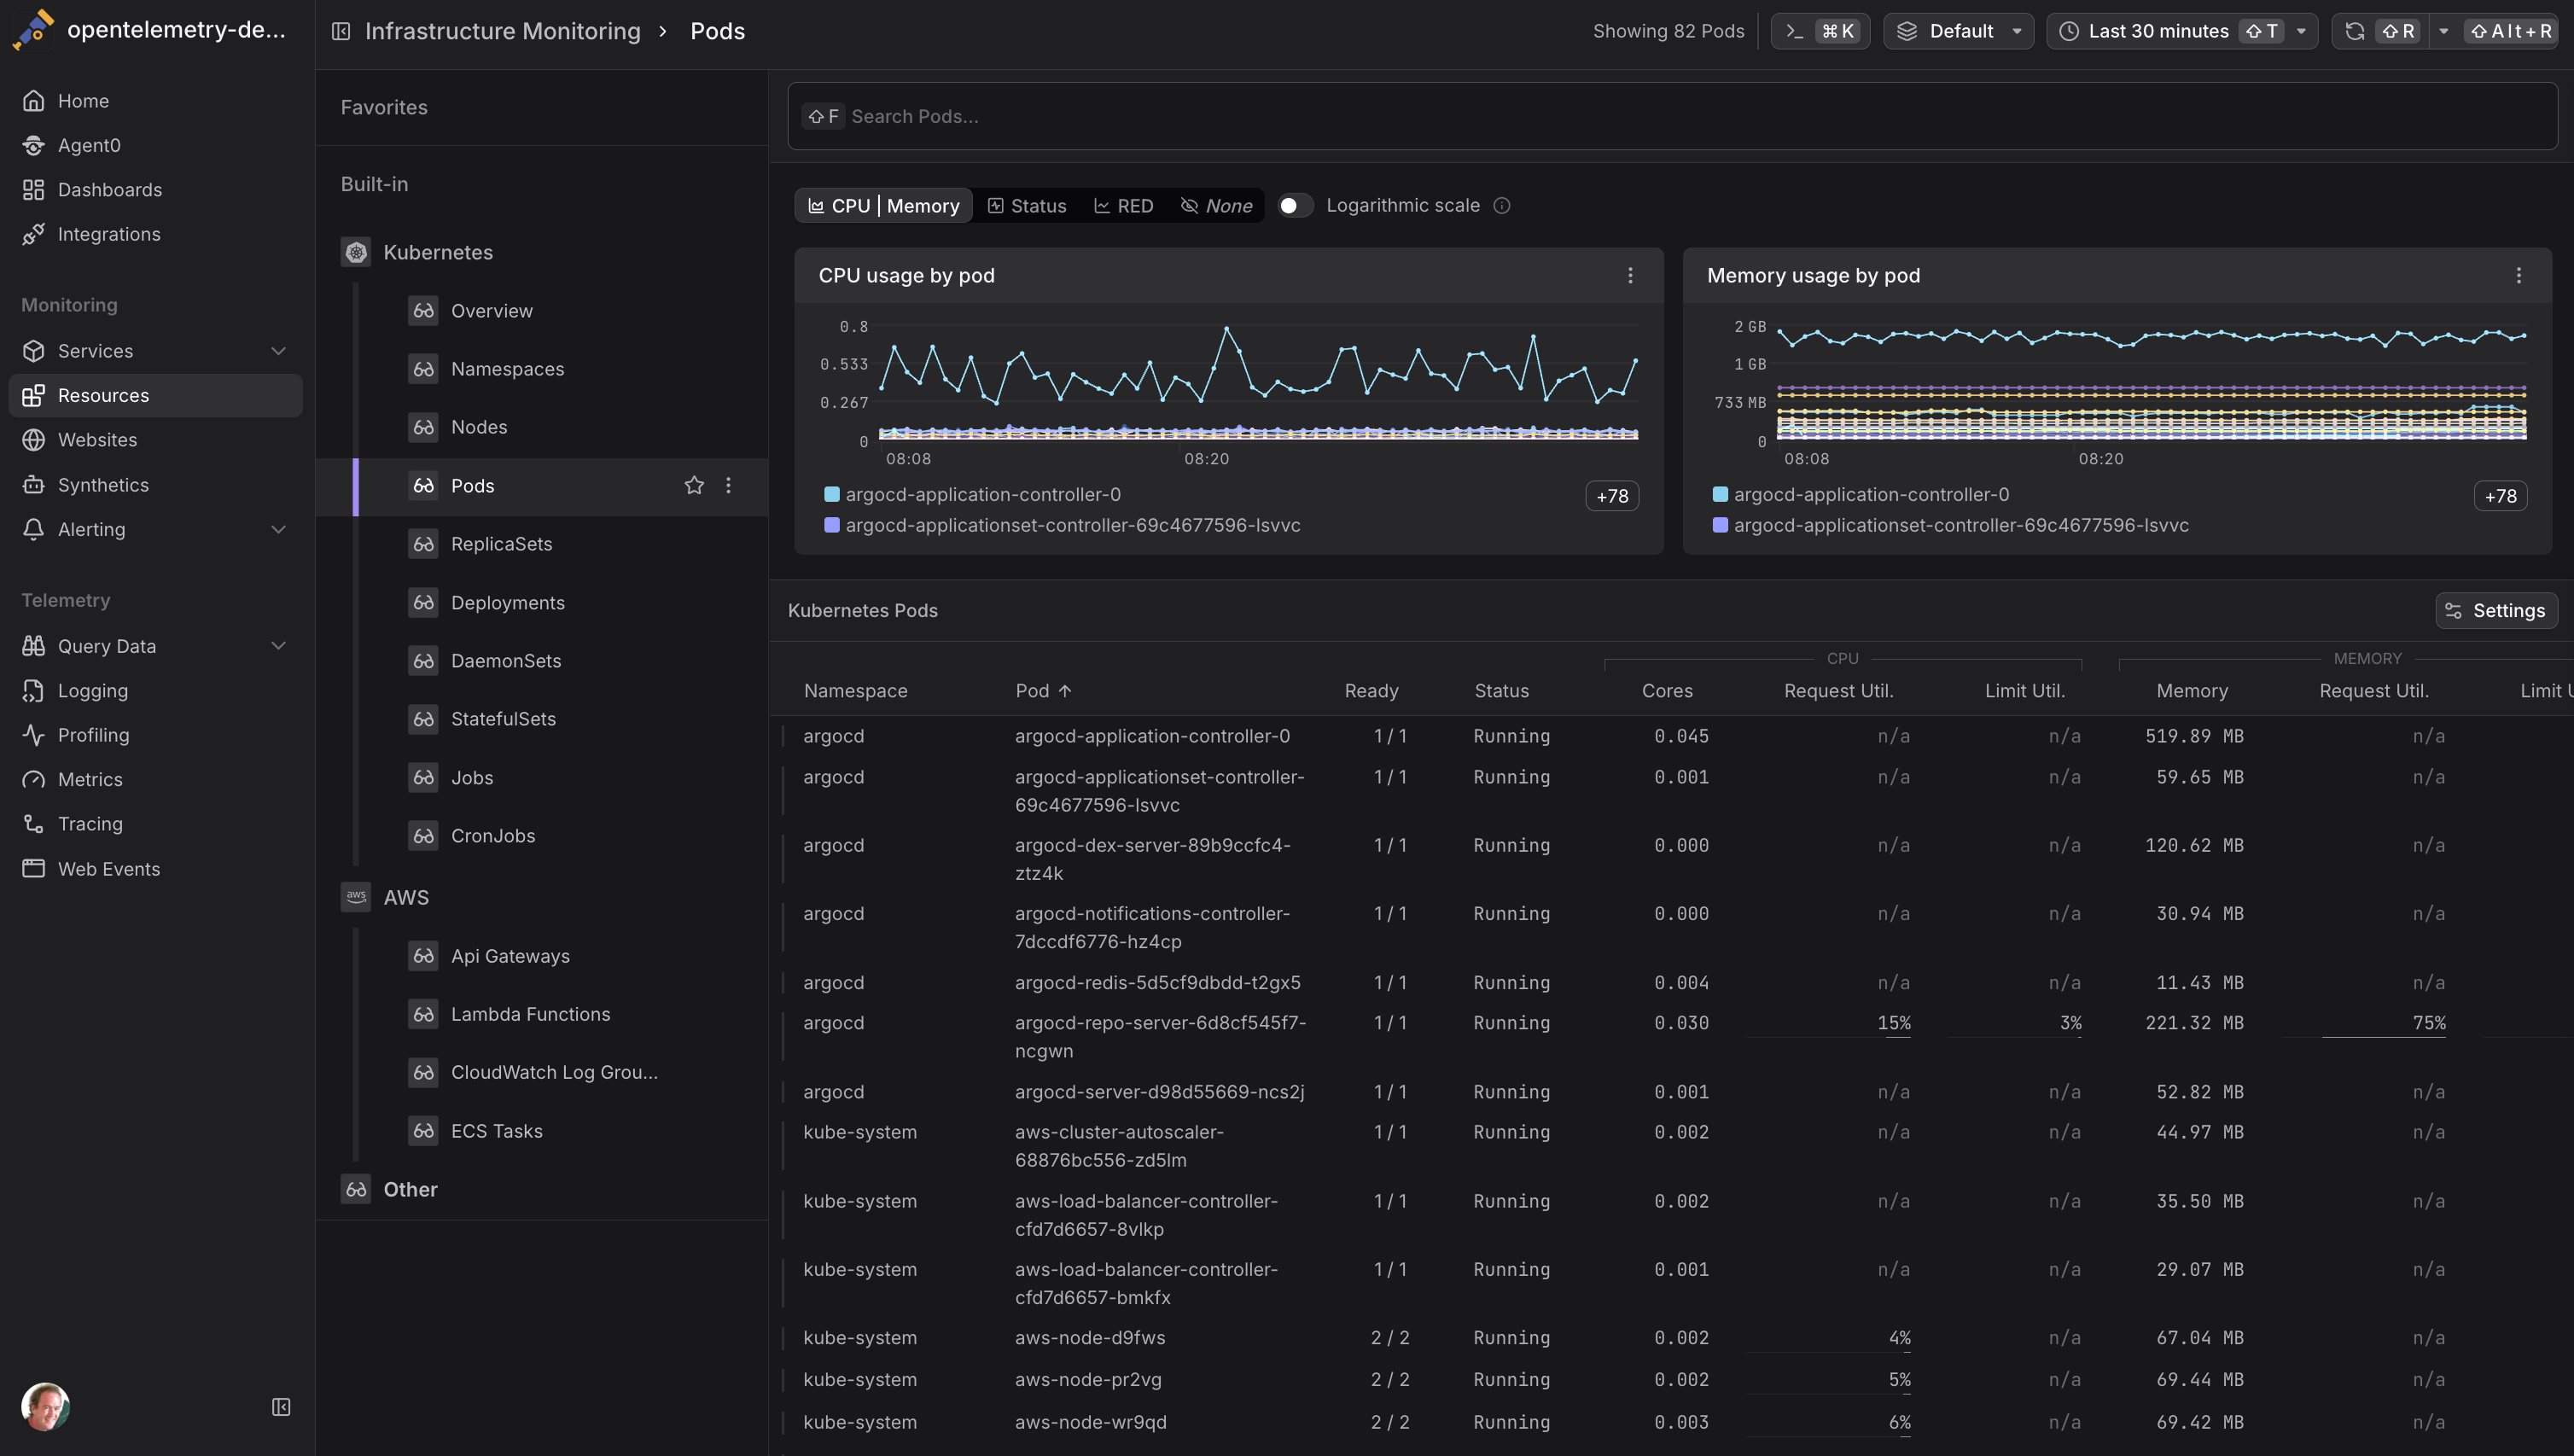
The Resources Explorer provides a unified interface for monitoring all your infrastructure and application resources across different platforms.
As an OpenTelemetry-native platform, Dash0 understands OpenTelemetry semantic conventions for resources and resource attributes, providing a complete picture even when data sources are fragmented across multiple telemetry collectors, SDKs, and agents.
Resources Navigation
The left sidebar organizes resources into categories:
- Kubernetes: Pods, deployments, nodes, services, and other Kubernetes resources organized hierarchically by cluster and namespace
- AWS: Lambda functions, ECS tasks, SQS queues, and other AWS resources
- GCP: TODO
- Other: Additional resources including hosts, containers, and custom resource types
Resources Table
The main table displays resources with real-time metrics:
- Resource Details: Name, namespace, type, and identifying attributes
- Performance Metrics: CPU usage, memory consumption, request rates, error rates, and latencies
- Time Series Charts: Visual representation of key metrics over the selected time range
- Filtering and Search: Filter by resource attributes, names, or metric values
Note
Resource names and types displayed in the table are automatically derived from OpenTelemetry attributes. For details on how Dash0 determines these, see References.
Further Reading
For more detailed information about resources and how Dash0 handles them, explore the following topics.
Related Topics in This Section
- About Resources: Overview of resources in Dash0
- Why Resource Equality?: Practical examples of resource fragmentation scenarios
- References: Complete reference for equality, naming, and typing rules
Dash0 Guides & Knowledge
- What are OpenTelemetry Resources?: Deep dive into how resources describe which system is generating telemetry data
- Service Attributes Best Practices: Learn what resource attributes are and how they can be categorized
- Kubernetes Attributes Best Practices: Best practices for Kubernetes resource attributes
OpenTelemetry Resources
- Resource Semantic Conventions: Official specification for resource attributes across different platforms
- Resource SDK: How to configure resources in OpenTelemetry SDKs