
Technology
Vercel
Monitor Vercel log drain events and link them to tracing data for comprehensive system visibility and troubleshooting.
Overview
Overview
Vercel's powerful front-end cloud accelerates and improves UI development. Projects hosted on Vercel natively generate logs and can generate tracing data through Vercel's @vercel/otel NPM package. You can fully leverage this data through Dash0.
Use Cases
- Correlate Vercel requests to non-Vercel hosted services and across Vercel projects.
- Understand performance of database queries.
- Alert on logging and tracing data.
- Retain observability data for longer periods of time.
Setup
Overview
Vercel's frontend cloud supports two types of telemetry: logs and traces. This guide will describe how to set up both, starting with logs, which is very easy thanks to Dash0's native Vercel integration.
Sending Vercel Logs to Dash0
In short, click the button below and follow the dialog.
Sending Vercel Traces to Dash0
Install the required dependencies
Vercel has its own distribution of the OpenTelemetry SDK called @vercel/sdk. It is fully compatible with the official
OpenTelemetry SDK, and adds helpful extensions.
npm install --save @vercel/otelOnly for Next.js <v15: Enable the experimental instrumentation hook
If you are using a Next.js version <15, you need to enable the Next.js instrumentation hook. Modify the file next.config.js with the following settings:
/** @type {import('next').NextConfig} */
const nextConfig = {
  experimental: {
    instrumentationHook: true,
  },
};

export default nextConfig;
Register the OpenTelemetry Instrumentation
Now you can initialize Vercel's OpenTelemetry SDK via a file called instrumentation.ts (see documentation, located directly in your src/ folder). Add the following content:
import { registerOTel } from "@vercel/otel";

export function register() {
  registerOTel({
    // Add your service name here instead of the placeholder
    serviceName: "my-first-observable-nextjs-service",
    instrumentationConfig: {
      fetch: {
        // By default the context is only propagated for the deployment URLs, all other URLs should be enabled explicitly in the list by string prefix or regex.
        propagateContextUrls: [],
      },
    },
  });
}
Set environment variables to configure the exporter in Vercel
As the last step, we need to tell the Next.js OpenTelemetry SDK where to send its data to, and how to authenticate. This can be achieved using the standardized OpenTelemetry headers and Vercel's environment variable support.
OTEL_EXPORTER_OTLP_ENDPOINT="{{endpoint_otlp_http}}"
OTEL_EXPORTER_OTLP_COMPRESSION="gzip"
OTEL_EXPORTER_OTLP_HEADERS="Authorization=Bearer {{token}},Dash0-Dataset=default"
Enjoy your Vercel traces in Dash0
Distributed tracing data will now arrive from Vercel within Dash0!
For an implementation example, refer to our Next.js & Vercel example application on GitHub.
Dashboards
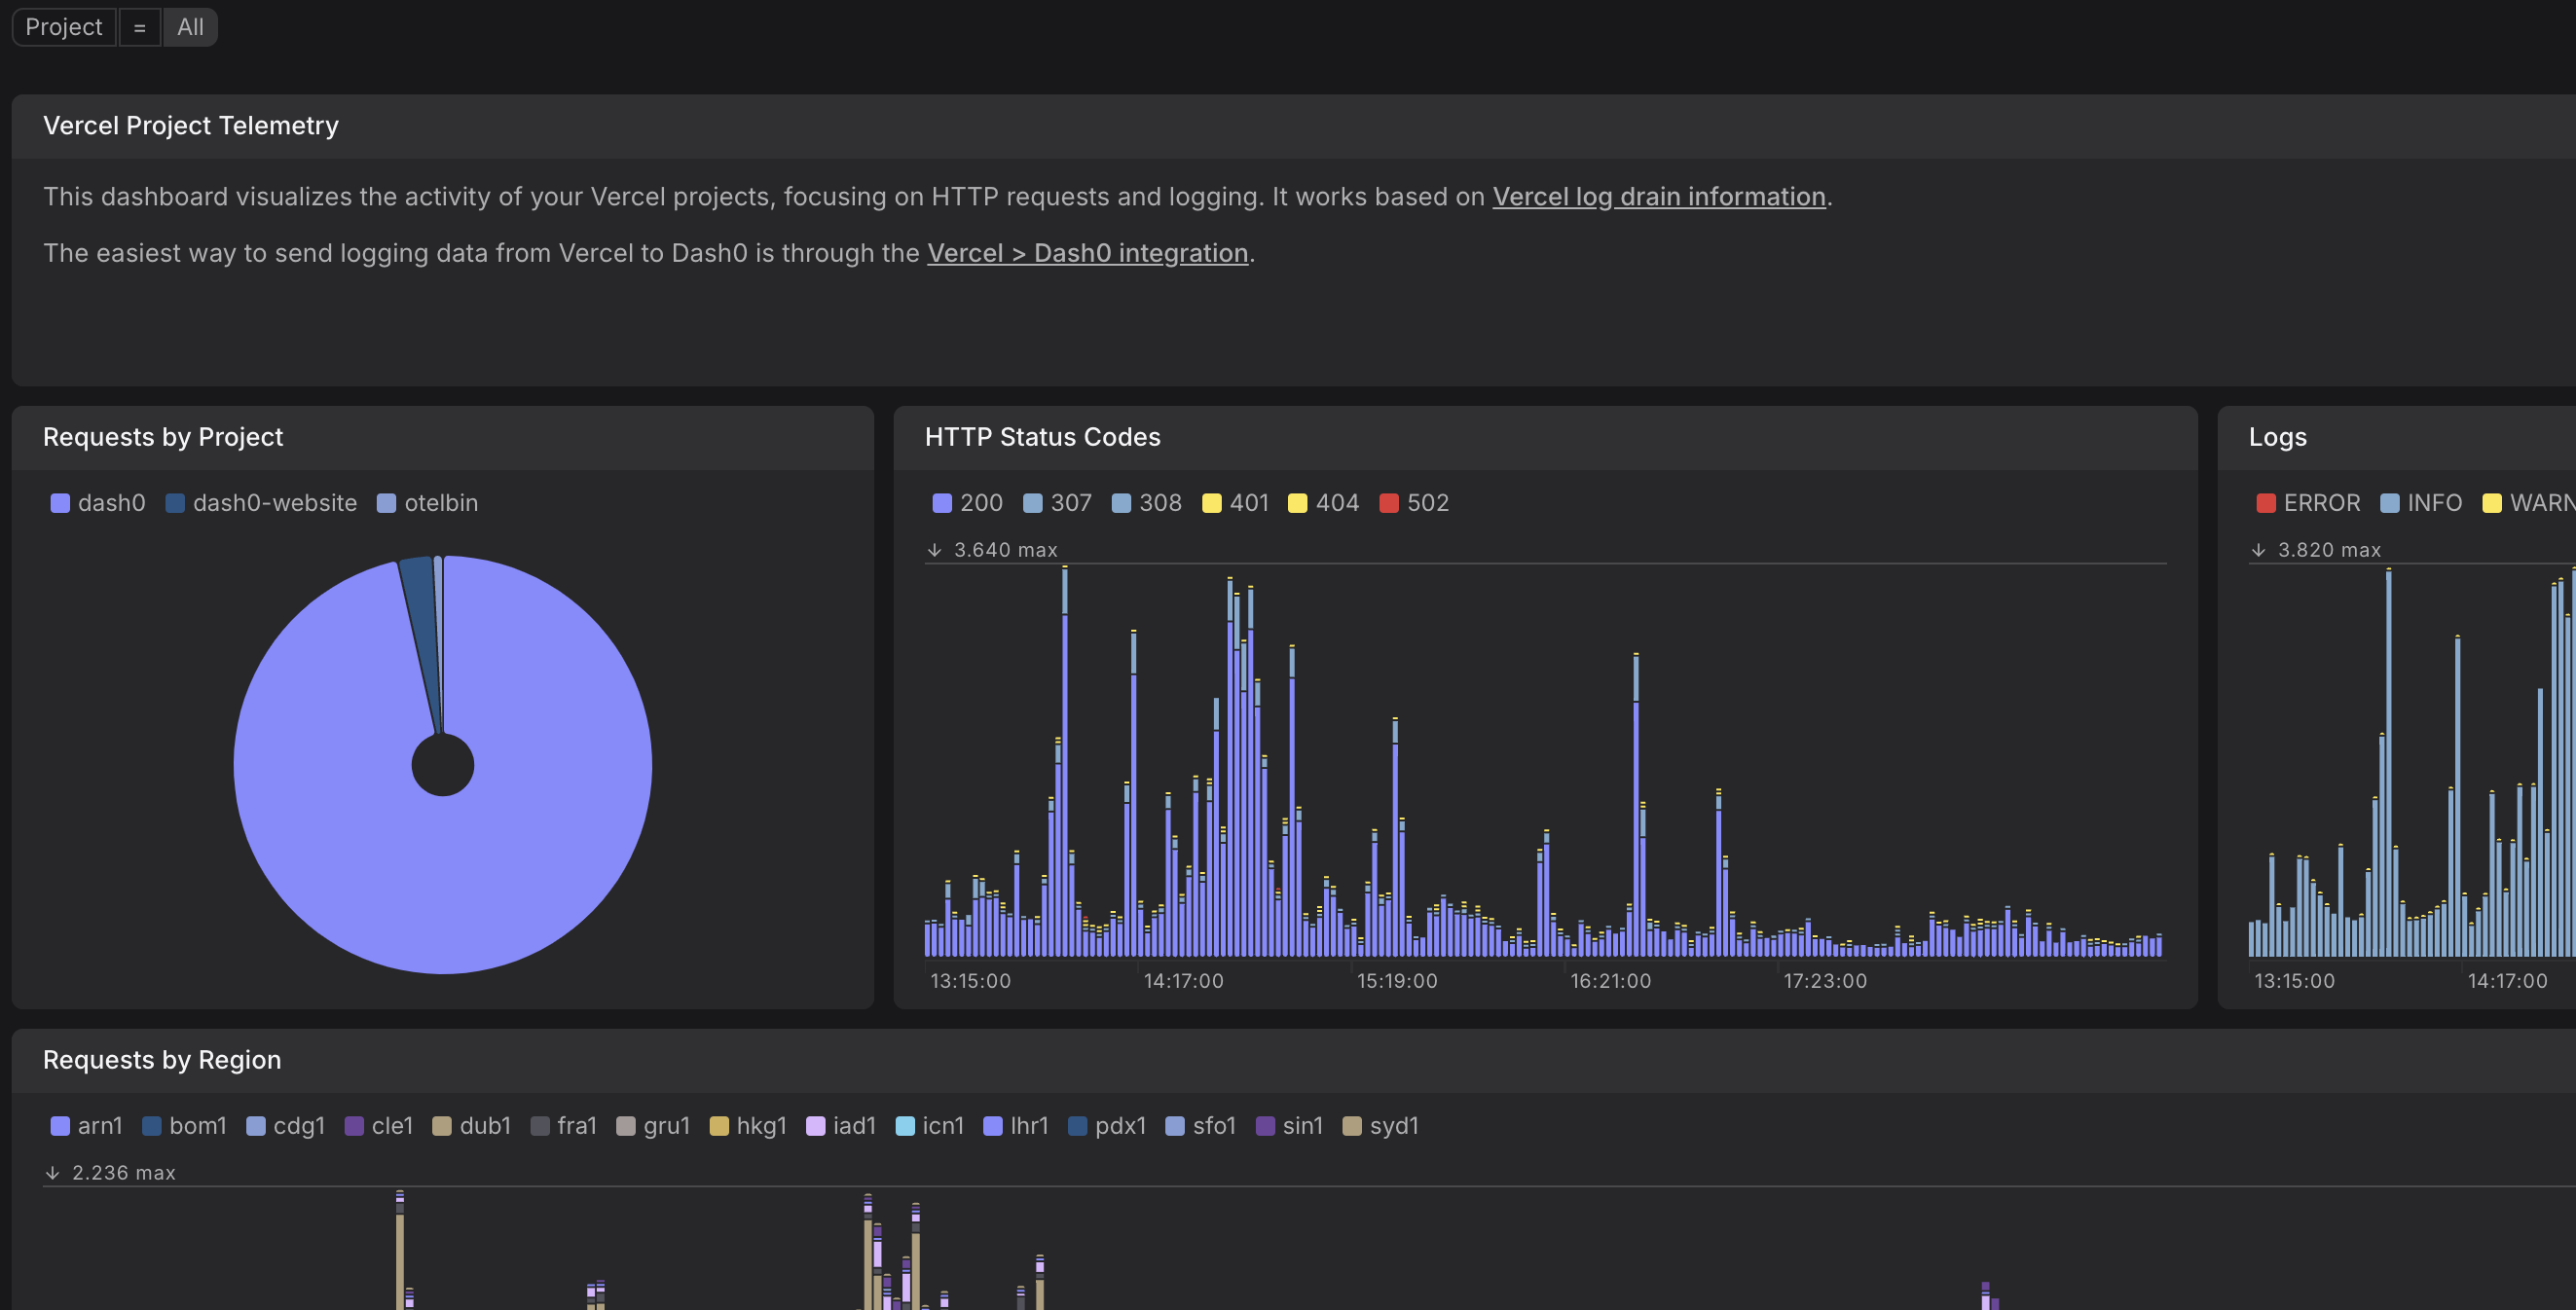
Vercel Log Drains
Insights into Vercel project's HTTP requests and logging activity.
Check Rules
Vercel deployment errors
Vercel deployment is experiencing errors
Alert triggers when Vercel deployments show elevated 5xx error rates above 5%.
(sum by (deployment_id) (rate({otel_metric_name="dash0.web.requests", vercel_deployment_id!="", http_status_code=~"5.."}[5m])) / sum by (deployment_id) (rate({otel_metric_name="dash0.web.requests", vercel_deployment_id!=""}[5m]))) * 100 > $__thresholdVercel deployment high response time
Vercel deployment response time is high
Alert triggers when 95th percentile response time exceeds 3 seconds.
histogram_quantile(0.95, sum by (deployment_id, le) (rate({otel_metric_name="dash0.web.requests.duration_bucket", vercel_deployment_id!=""}[5m]))) * 1000 > $__thresholdVercel deployment request rate anomaly
Unusual request rate detected in Vercel deployment
Alert triggers when request rate changes significantly compared to previous hour.
abs(sum by (deployment_id) (rate({otel_metric_name="dash0.web.requests", vercel_deployment_id!=""}[5m])) - sum by (deployment_id) (rate({otel_metric_name="dash0.web.requests", vercel_deployment_id!=""}[5m] offset 1h))) > $__thresholdVercel preview deployment issues
Vercel preview deployment health issues
Alert triggers when preview deployments show elevated error rates above 10%.
(sum by (vercel_branch) (rate({otel_metric_name="dash0.web.requests", deployment_environment_name="preview", http_status_code=~"4..|5.."}[5m])) / sum by (vercel_branch) (rate({otel_metric_name="dash0.web.requests", deployment_environment_name="preview"}[5m]))) * 100 > $__threshold