Dash0 Raises $110M Series B at $1B Valuation
Monitor Traefik ingress controller performance, request routing, and traffic patterns with OpenTelemetry metrics and distributed tracing.
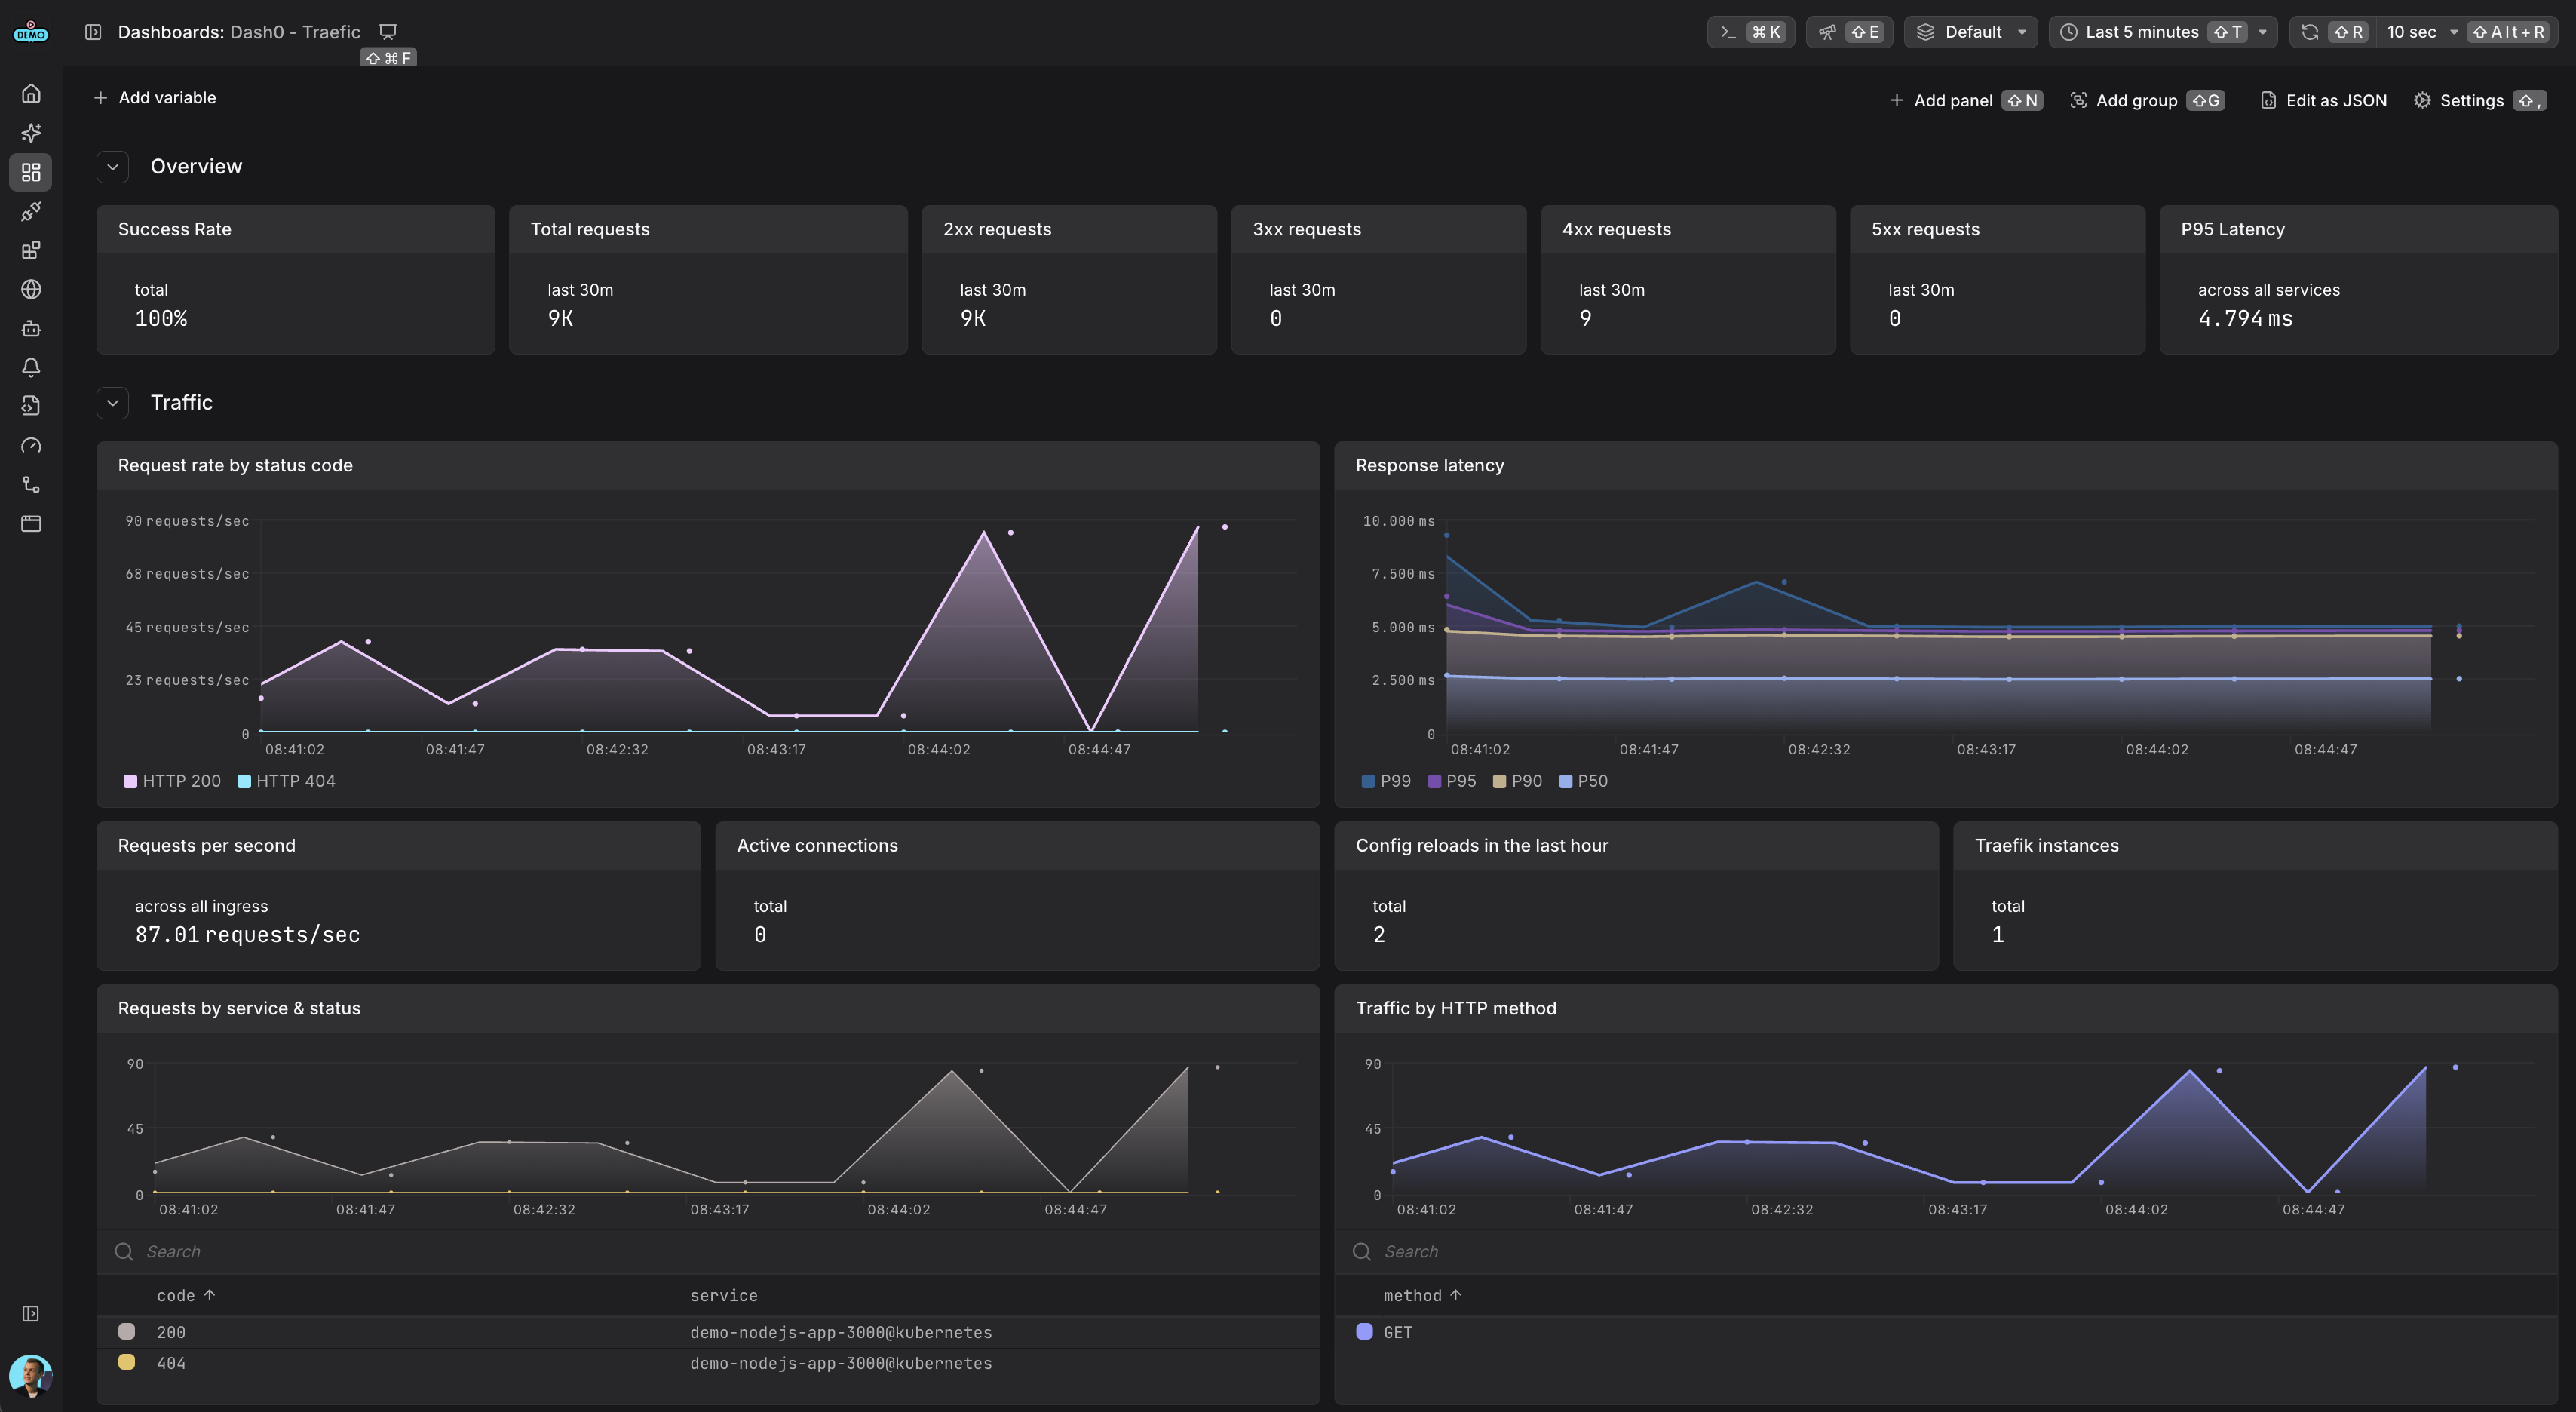
Monitor Traefik service request rates, latency percentiles, HTTP status codes, and active connections
Traefik is a modern open-source application proxy that acts as an edge router, ingress controller, and API gateway for microservices and cloud-native architectures. It automatically discovers services from your infrastructure and dynamically configures routing without manual intervention.
The Dash0 integration provides complete observability for Traefik deployments using OpenTelemetry-native instrumentation for metrics and distributed tracing, plus structured JSON access logs.
For more information, visit the Traefik Observability Documentation.
Gain comprehensive visibility into your Traefik setup and optimize performance with the following observability features:
Use this integration to streamline monitoring of your edge traffic, debug routing issues, and ensure your platform services are operating efficiently.
Traefik includes built-in support for observability via OpenTelemetry metrics, distributed tracing, and structured access logs. This integration uses the recommended pattern of deploying an OpenTelemetry Collector in your cluster to collect telemetry from Traefik and forward it to Dash0.
For more details, refer to the Traefik Observability Documentation.
You'll need an OpenTelemetry Collector deployed in your cluster to collect telemetry from Traefik and forward it to Dash0.
For production environments, consider using one of these deployment methods:
Helm Chart for The OpenTelemetry Collector
For a complete working example with collector configuration, see the Dash0 Traefik Example.
values.yaml FileConfigure Traefik to export metrics and traces to an OpenTelemetry Collector in your cluster by storing the following configuration in a values.yaml file:
Note:
prometheus: null disables Prometheus metrics to avoid duplicate metric collectionThis configuration enables:
Create a dedicated namespace for Traefik (optional but recommended), then install it using Helm:
This installs Traefik with the specified configuration to export observability data to Dash0.
Once deployed, Traefik will send telemetry to the OpenTelemetry Collector, which then forwards to Dash0:
The OpenTelemetry Collector acts as a central aggregation point, handling authentication with Dash0 and providing additional processing capabilities like sampling, filtering, and enrichment.
For more details, refer to the Traefik Metrics, Tracing, and Access Logs documentation.
For a complete working example with Traefik, OpenTelemetry Collector, and demo applications, see the Dash0 Traefik Example.