Dash0 Logo
Infrastructure MonitoringLog ManagementApplication Performance ManagementDistributed TracingKubernetes MonitoringWebsite MonitoringSynthetic MonitoringDashboardsAlertingService MapIntegrationsTransparent CostObservability as Code
PricingDocs
GuidesBlogKnowledgeComparisonsPodcastIntegrationsChangelog
Contact usMeet our TeamCareersSecurity
  • Book A Demo
  • Sign In
  • Start Free Trial
Book a demoSign in
Start Free Trial

Resources

  • Pricing
  • Blog
  • Guides
  • Knowledge
  • Comparisons
  • Integrations
  • Documentation
  • Glossary
  • OTelBin.io
  • Sitemap

Company

  • Our Team
  • Careers
  • Trust Center
  • Security

Compare

  • Datadog
  • Grafana
  • Dynatrace
  • New Relic
  • Elastic
  • Honeycomb
  • Sentry

Contact

  • Contact us
  • GitHub
  • LinkedIn
  • X
  • YouTube
  • Dash0 Newsletter
  • Terms and Conditions
  • Privacy Policy
  • Data Processing Agreement
  • Vulnerability Disclosure

©2025 Dash0 Inc.

Hub/RabbitMQ

Technology

RabbitMQ

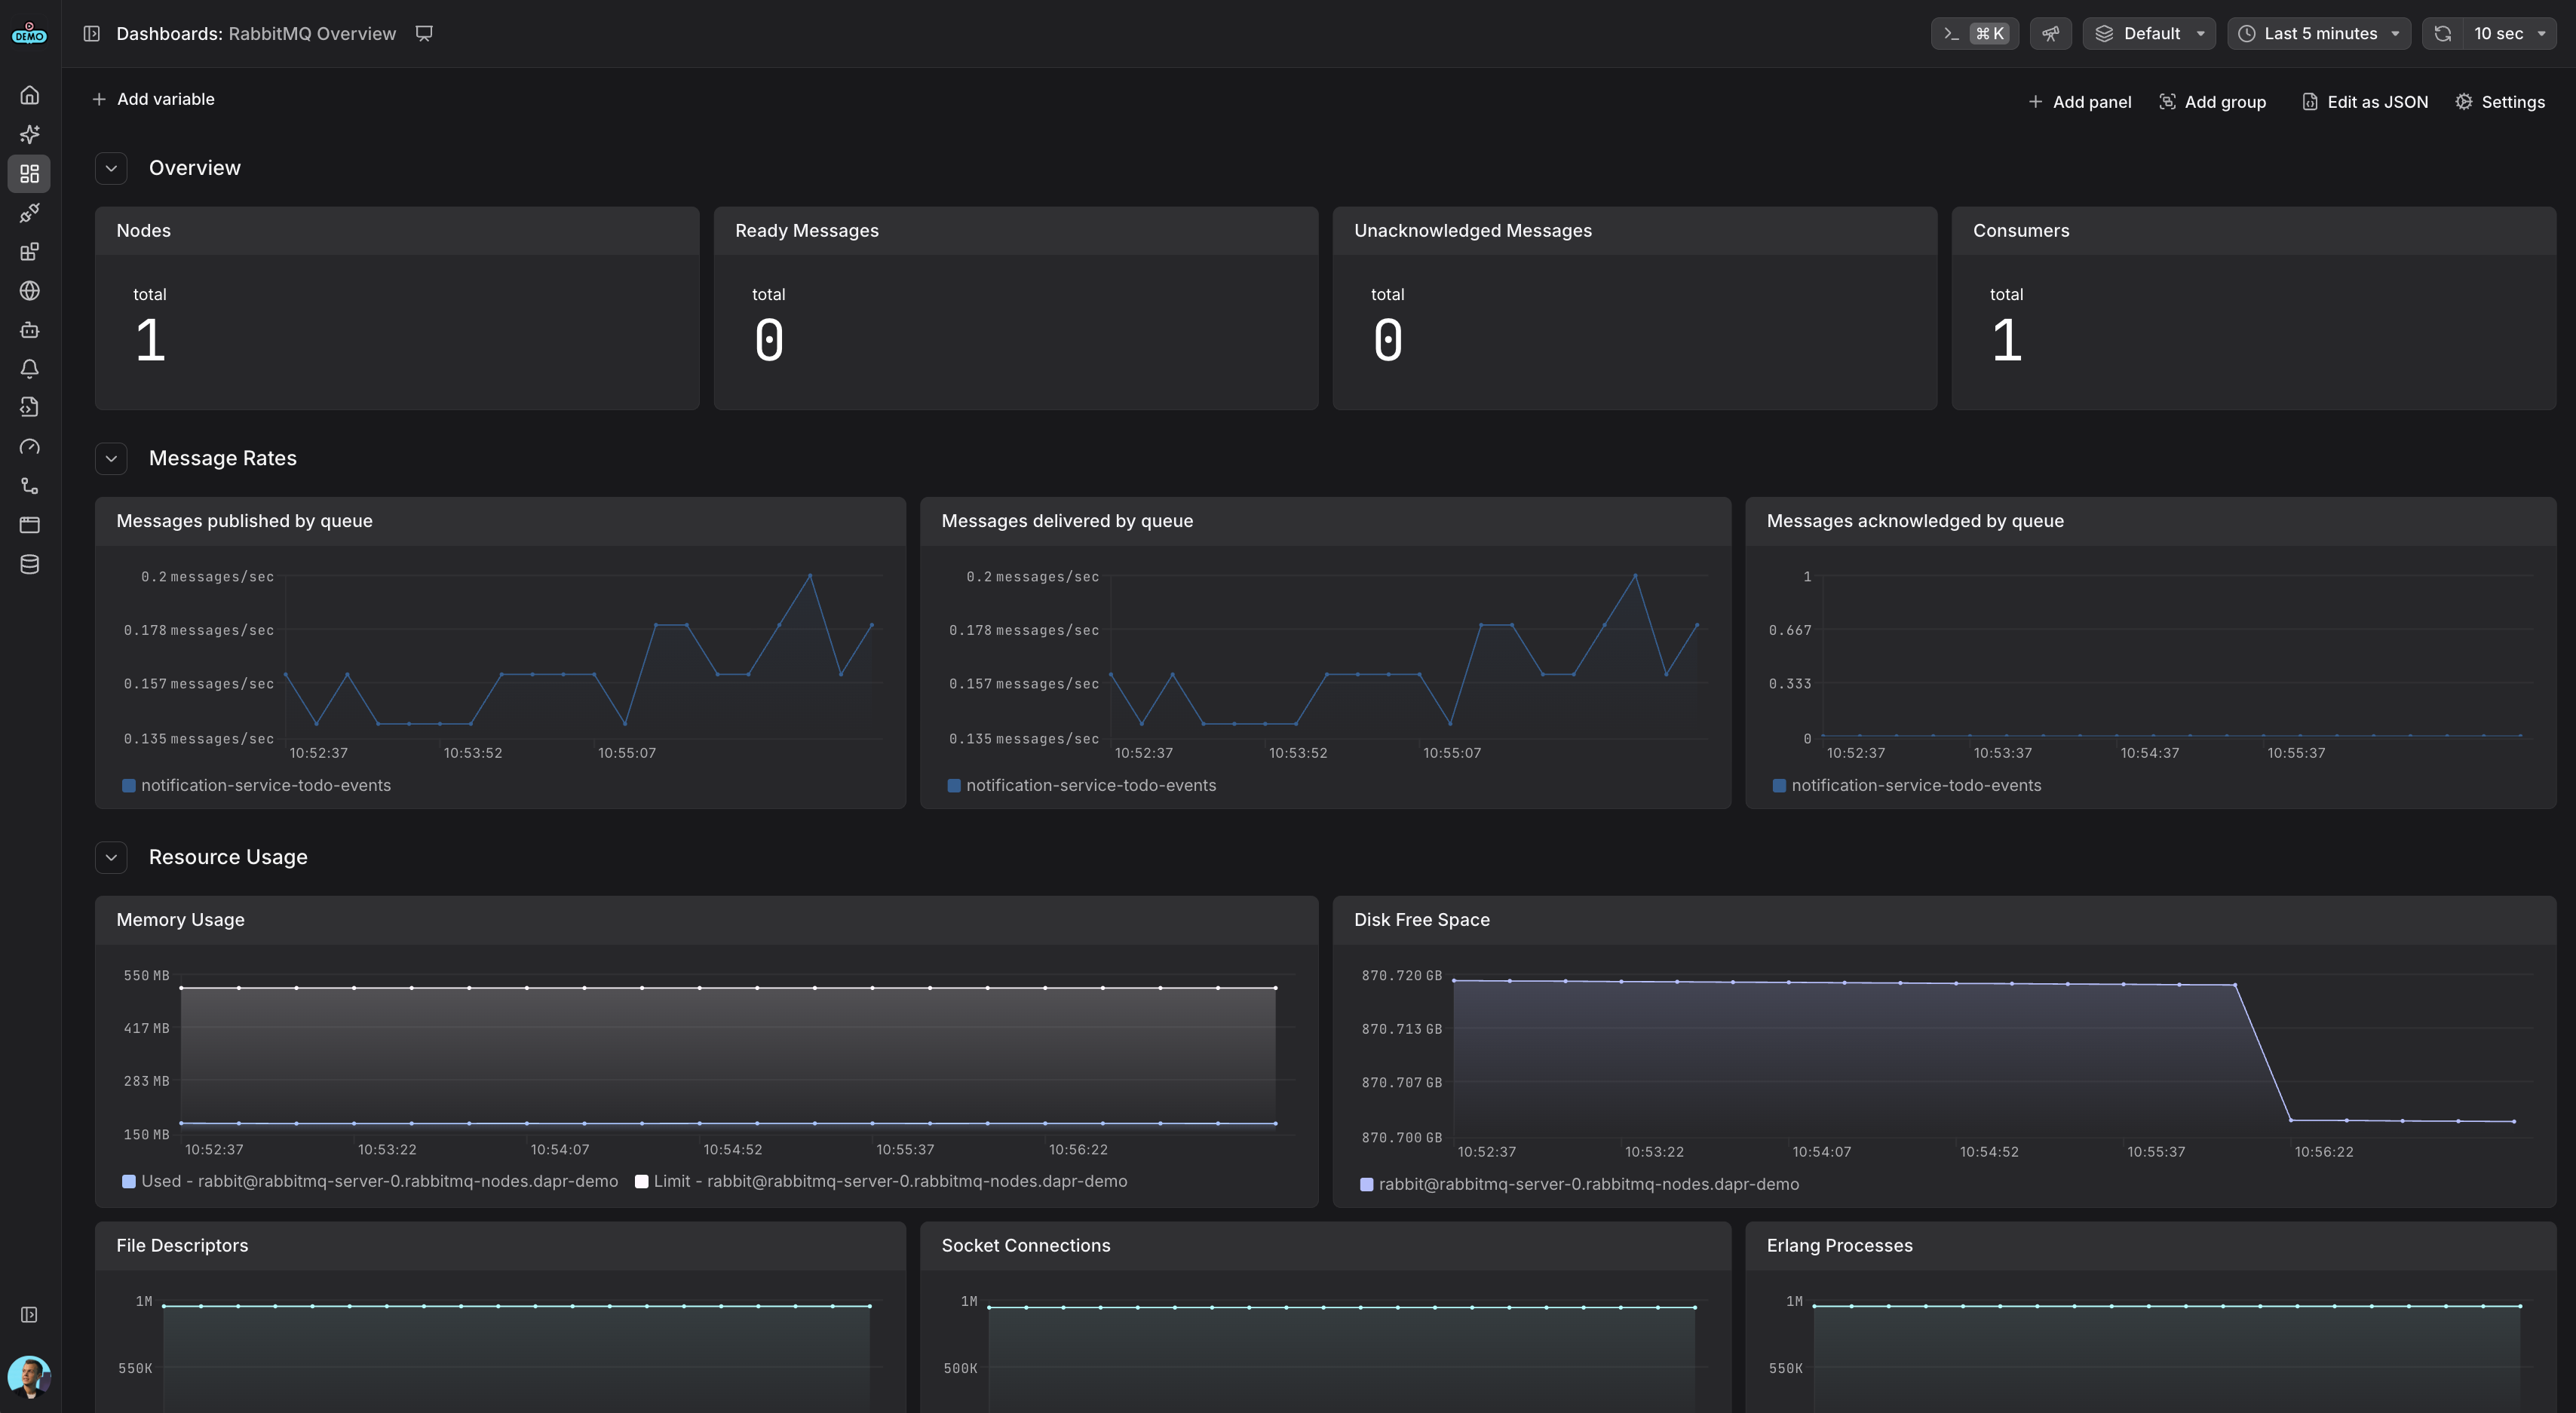
Monitor RabbitMQ message queues and cluster performance. Track queue depth, message rates, consumer health, and resource utilization.

Overview

Overview

RabbitMQ is a robust, reliable open-source message broker that implements multiple messaging protocols including AMQP, MQTT, and STOMP. It enables distributed applications to communicate through message queues, providing reliable message delivery, flexible routing, and clustering capabilities for high availability.

Use Cases

  • Monitor queue depth and message throughput across all queues
  • Track consumer performance and connection health
  • Analyze memory usage and disk space consumption
  • Monitor cluster health and node synchronization
  • Track message publish, delivery, and acknowledgment rates

Dashboards

RabbitMQ Overview

Comprehensive RabbitMQ monitoring dashboard showing queue metrics, message rates, and resource utilization

[message broker]
[rabbitmq]
RabbitMQ overview
In this section
    TechnologyOverviewUse CasesSetupOverviewPrerequisitesSetting up RabbitMQUsing RabbitMQ Operator on KubernetesManual RabbitMQ SetupCollector ConfigurationEnvironment VariablesCollector DeploymentVerificationAvailable MetricsNode MetricsMessage MetricsConsumer MetricsReferencesDashboards

Setup

Overview

RabbitMQ exposes comprehensive metrics through its management plugin that can be collected using the OpenTelemetry Collector's RabbitMQ receiver. This integration provides deep visibility into queue performance, message rates, consumer health, and resource utilization.

Prerequisites

Before setting up RabbitMQ monitoring, ensure:

  • RabbitMQ is running with the management plugin enabled
  • The management API is accessible (default port: 15672)
  • You have credentials to access the RabbitMQ management interface
  • OpenTelemetry Collector is deployed in your environment using the OpenTelemetry Collector contrib distribution.

Setting up RabbitMQ

Using RabbitMQ Operator on Kubernetes

For Kubernetes environments, we recommend using the RabbitMQ Cluster Operator to deploy and manage RabbitMQ clusters.

Install the RabbitMQ Operator

Deploy a RabbitMQ Cluster

Create a RabbitMQ cluster with the management plugin enabled:

Manual RabbitMQ Setup

If deploying RabbitMQ manually, ensure the management plugin is enabled:

Collector Configuration

The OpenTelemetry Collector uses the RabbitMQ receiver to collect metrics from the RabbitMQ management API. Add the following configuration to your collector:

For more configuration options see the receiver documentation in the OpenTelemetry Collector contrib repository

Environment Variables

Configure the following environment variables for the collector:

  • RABBITMQ_USERNAME: RabbitMQ management username
  • RABBITMQ_PASSWORD: RabbitMQ management password

Collector Deployment

Deploy the OpenTelemetry Collector with the RabbitMQ receiver configuration. For detailed deployment instructions, see our other integrations for deploying the OpenTelemetry Collector:

  • OpenTelemetry Operator for Kubernetes
  • Helm Chart for The OpenTelemetry Collector

Verification

After configuring the collector, verify that metrics are being collected:

  1. Check the collector logs for successful connections to RabbitMQ
  2. Navigate to the Metrics Explorer in Dash0
  3. Search for metrics with prefix rabbitmq.
  4. Verify key metrics like rabbitmq.message.published and rabbitmq.node.mem_used are appearing

Available Metrics

The RabbitMQ receiver collects the following key metrics:

Node Metrics

  • rabbitmq.node.disk_free: Available disk space
  • rabbitmq.node.mem_used: Memory usage
  • rabbitmq.node.fd_used: File descriptors in use
  • rabbitmq.node.sockets_used: Network sockets in use
  • rabbitmq.node.proc_used: Erlang processes in use

Message Metrics

  • rabbitmq.message.published: Messages published to queues
  • rabbitmq.message.delivered: Messages delivered to consumers
  • rabbitmq.message.acknowledged: Messages acknowledged by consumers
  • rabbitmq.message.current: Current messages in queues (ready and unacknowledged)

Consumer Metrics

  • rabbitmq.consumer.count: Number of consumers connected

References

  • OpenTelemetry RabbitMQ Receiver Documentation
  • RabbitMQ Management Plugin
  • RabbitMQ Cluster Operator