Dash0 Raises $110M Series B at $1B Valuation
Monitor PostgreSQL database performance, query execution, and resource utilization. Track connection pools, disk usage, replication lag, and database health.
PostgreSQL is a powerful, open-source relational database system renowned for its reliability, feature robustness, and performance. It supports advanced SQL features, complex queries, and provides extensibility with custom data types, operators, and functions.
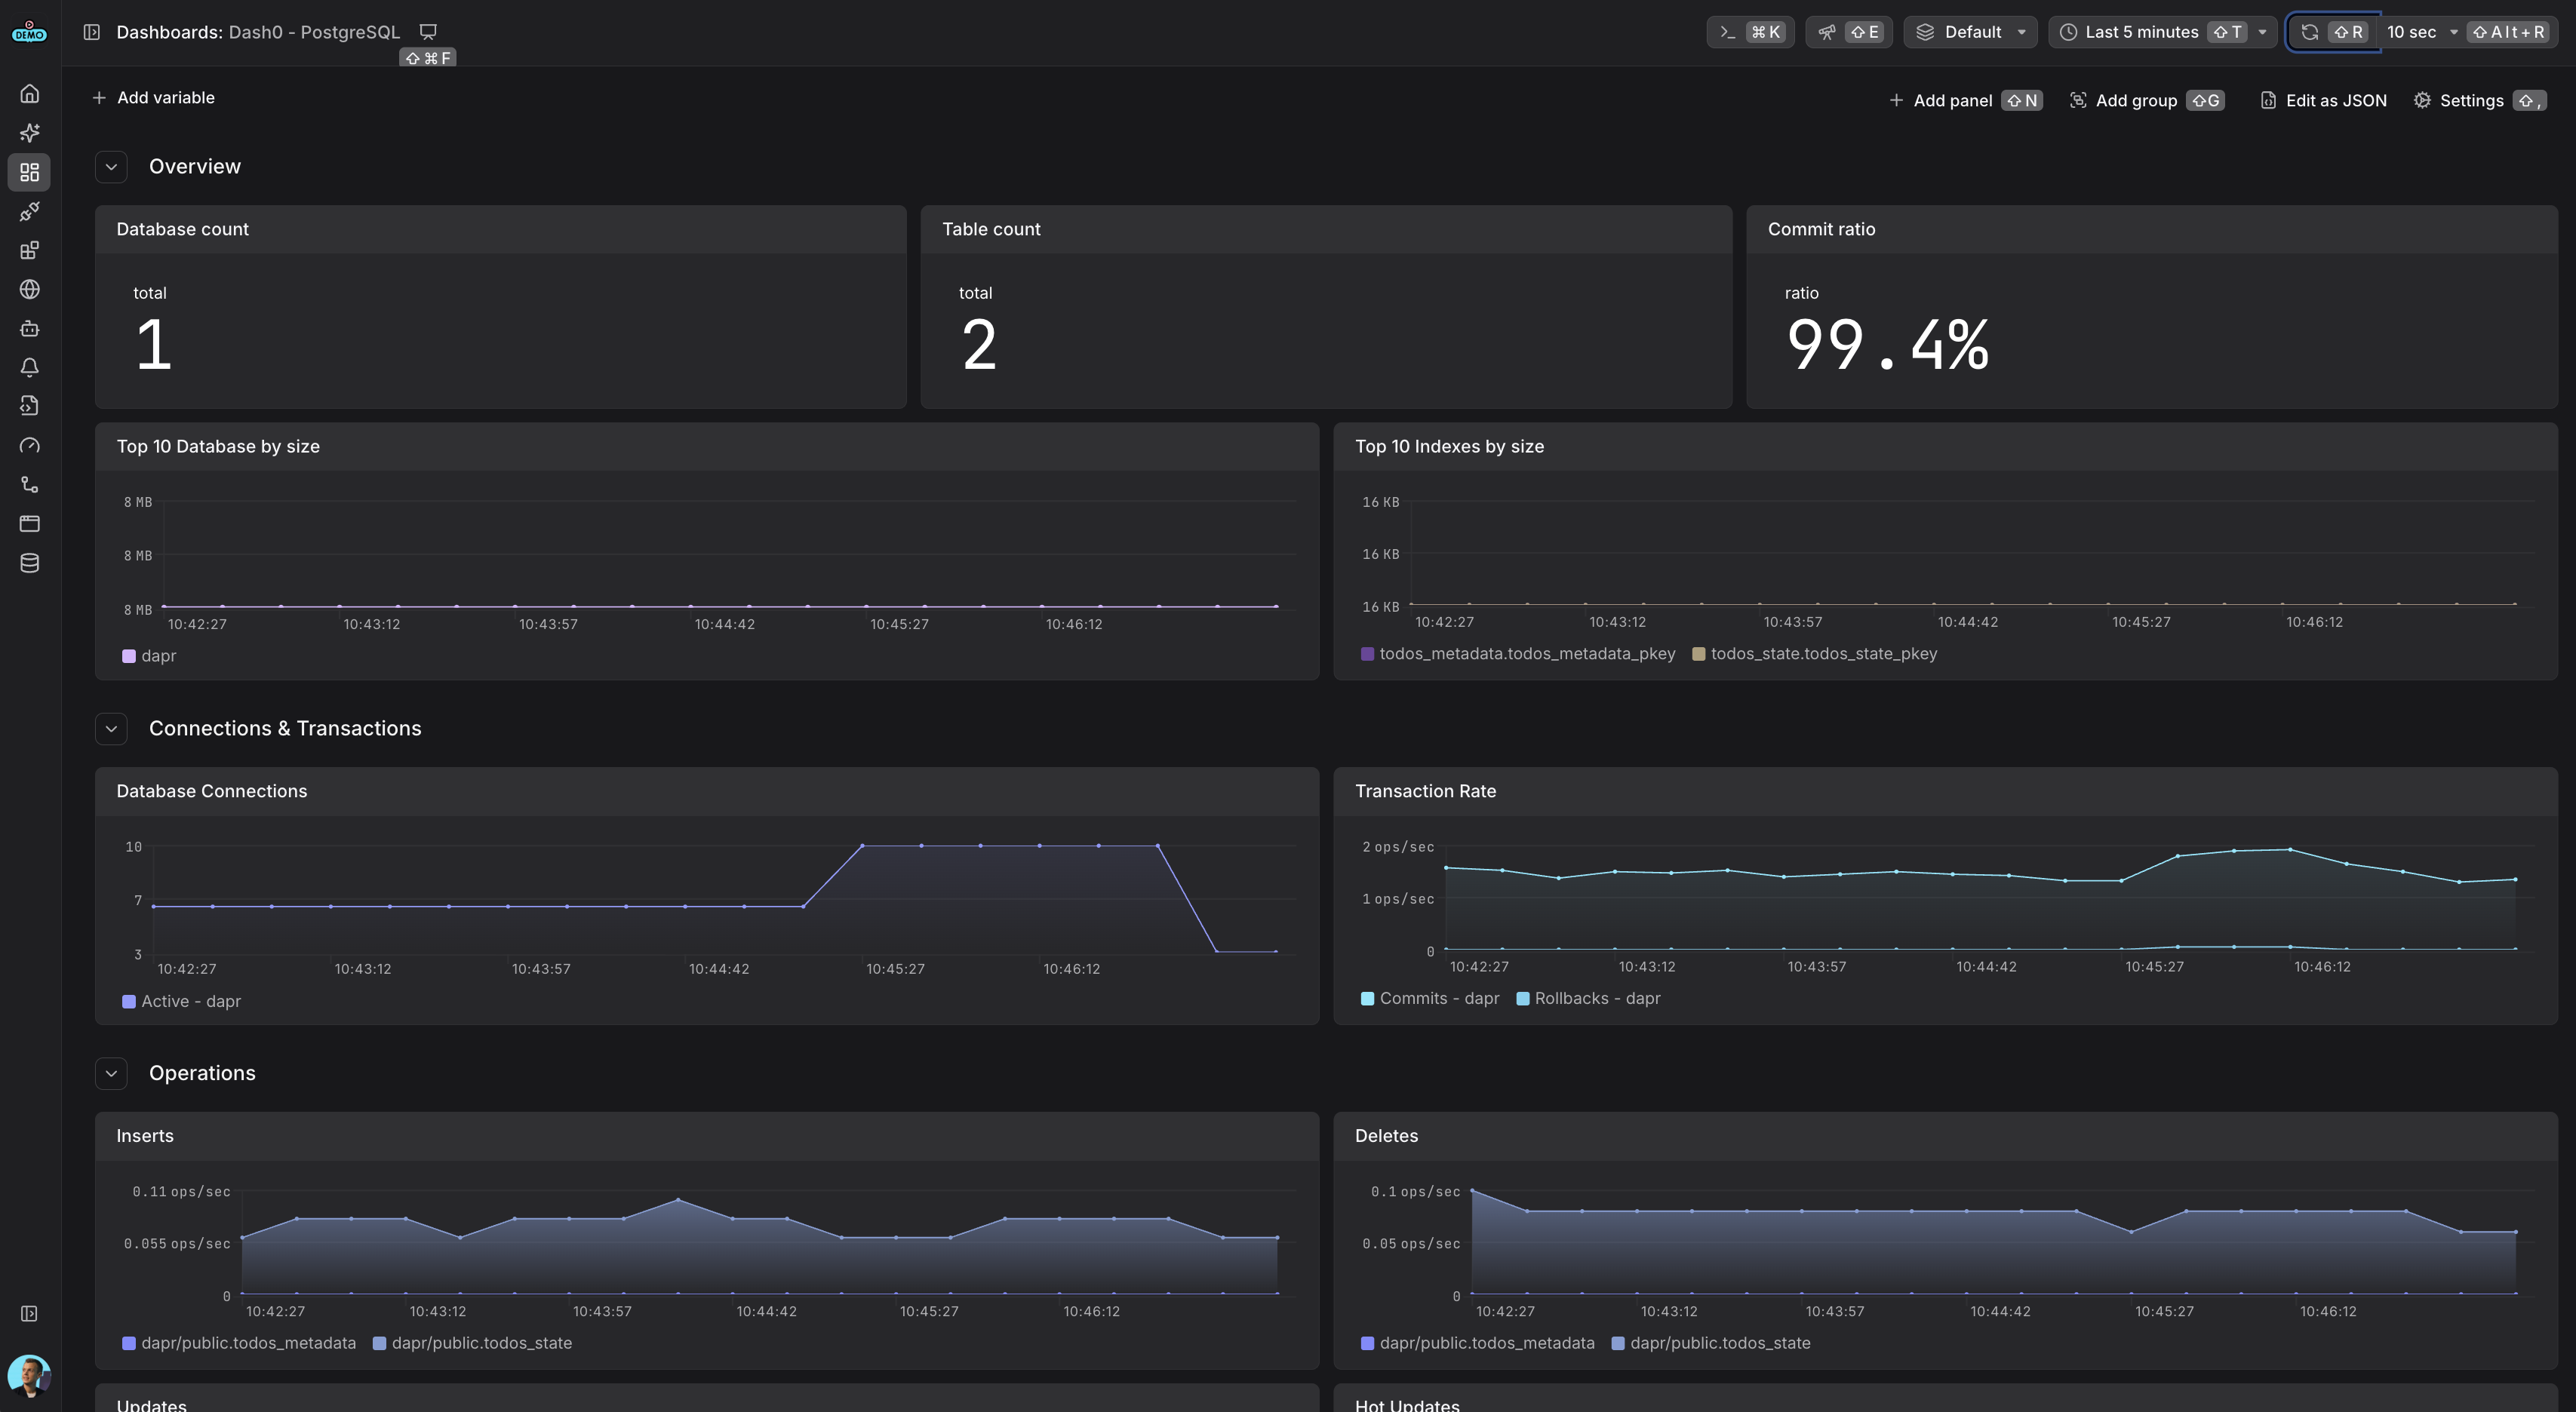
PostgreSQL monitoring dashboard showing database metrics, connection health, and performance statistics
PostgreSQL exposes comprehensive metrics through its built-in statistics views that can be collected using the OpenTelemetry Collector's PostgreSQL receiver. This integration provides deep visibility into database performance, query execution, connection management, and resource utilization.
Before setting up PostgreSQL monitoring, ensure:
pg_stat_statements extension is enabled for query-level metrics (optional but recommended)For Kubernetes environments, we recommend using a PostgreSQL operator for production-ready deployments. Here's an example using CloudNativePG, which provides comprehensive PostgreSQL clusters with built-in monitoring capabilities.
Note: This is just one example of a production setup. You can use any PostgreSQL deployment method (including other operators like Zalando PostgreSQL Operator, CrunchyData PGO, or manual deployments) as long as the PostgreSQL receiver can connect to your database.
Here's a simple example that relies on CloudNativePG's defaults:
For production environments:
instances: 3 for high availabilityFor non-Kubernetes environments or custom setups:
For comprehensive query monitoring, enable the pg_stat_statements extension:
Add to your postgresql.conf:
Connect to your database and run:
For security best practices, create a dedicated monitoring user with the built-in pg_monitor role:
The OpenTelemetry Collector uses the PostgreSQL receiver to collect metrics from PostgreSQL statistics views. Add the following configuration to your OpenTelemetry collector:
Add the PostgreSQL receiver to your collector configuration:
For more options see the PostgreSQL receiver documentation
Deploy the OpenTelemetry Collector with the PostgreSQL receiver configuration. For detailed deployment instructions, see our other integrations for deploying the OpenTelemetry Collector:
After configuring the collector, verify that metrics are being collected:
postgresql.*postgresql.backends (active connections)postgresql.connection.max (configured max connections)postgresql.db_size (database size in bytes)postgresql.commits (transaction commits)postgresql.rollbacks (transaction rollbacks)