Dash0 Raises $110M Series B at $1B Valuation
Monitor MySQL database performance, query execution, and resource utilization. Track connections, buffer pool efficiency, replication, and database health.
MySQL is one of the most popular open-source relational database, renowned for its reliability, ease of use, and performance. It powers countless web applications and services, from small websites to large-scale enterprise systems, providing robust data storage with ACID compliance and support for complex queries.
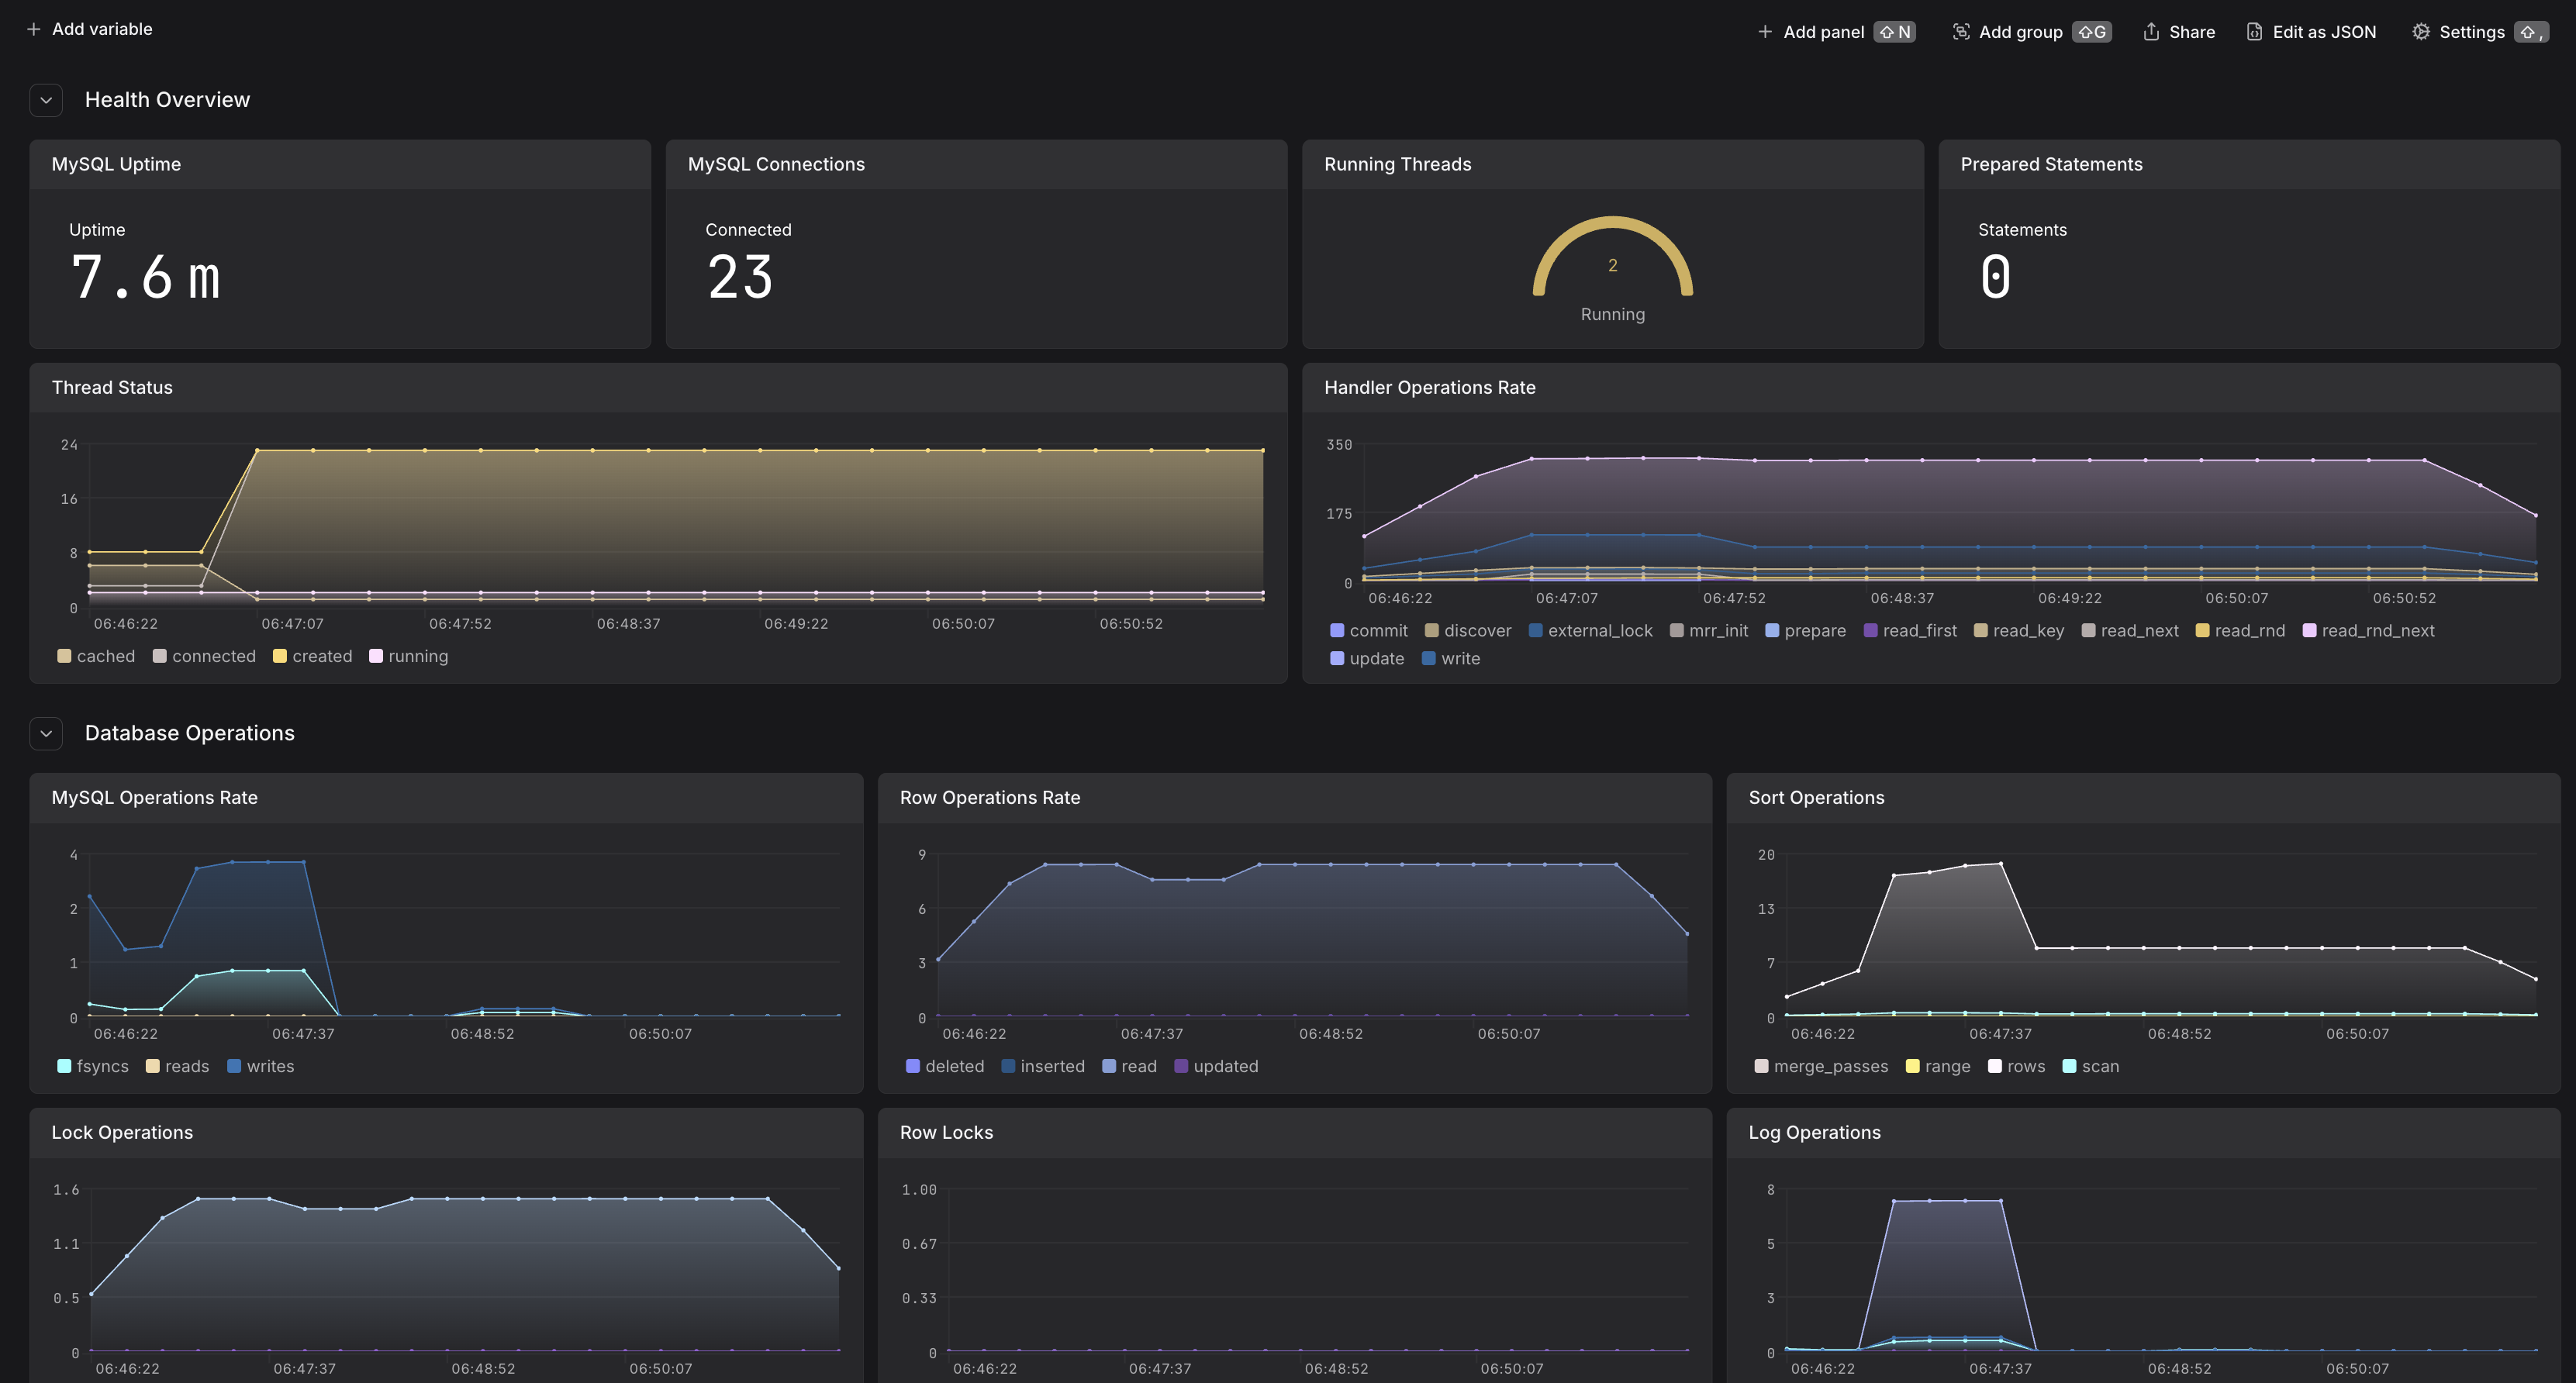
MySQL monitoring dashboard showing database health, operations, buffer pool, and wait time insights
MySQL exposes comprehensive metrics through its performance schema and status variables that can be collected using the OpenTelemetry Collector's MySQL receiver. This integration provides deep visibility into database performance, connection management, buffer pool efficiency, and resource utilization.
Before setting up MySQL monitoring, ensure:
For security best practices, create a dedicated monitoring user with the minimum required privileges.
Connect to your MySQL database and run:
The required grants are:
Ensure the Performance Schema is enabled (it's enabled by default in MySQL 5.6+):
If it's disabled, enable it by adding this to your my.cnf:
The OpenTelemetry Collector uses the MySQL receiver to collect metrics from MySQL's performance schema and status variables. Add the following configuration to your OpenTelemetry collector:
host:port)For more configuration options, see the MySQL receiver documentation.
Configure the following environment variable for the collector:
Deploy the OpenTelemetry Collector with the MySQL receiver configuration. For detailed deployment instructions, see our other integrations for deploying the OpenTelemetry Collector:
After configuring the collector, verify that metrics are being collected:
mysql.*mysql.uptime (server uptime in seconds)mysql.threads (connection and thread counts)mysql.connections (connection metrics)mysql.buffer_pool.usage (InnoDB buffer pool usage)mysql.operations (database operations rate)