Dash0 Raises $110M Series B at $1B Valuation
Monitor kgateway API Gateway performance, traffic routing, and resource usage with native OpenTelemetry metrics and distributed tracing.
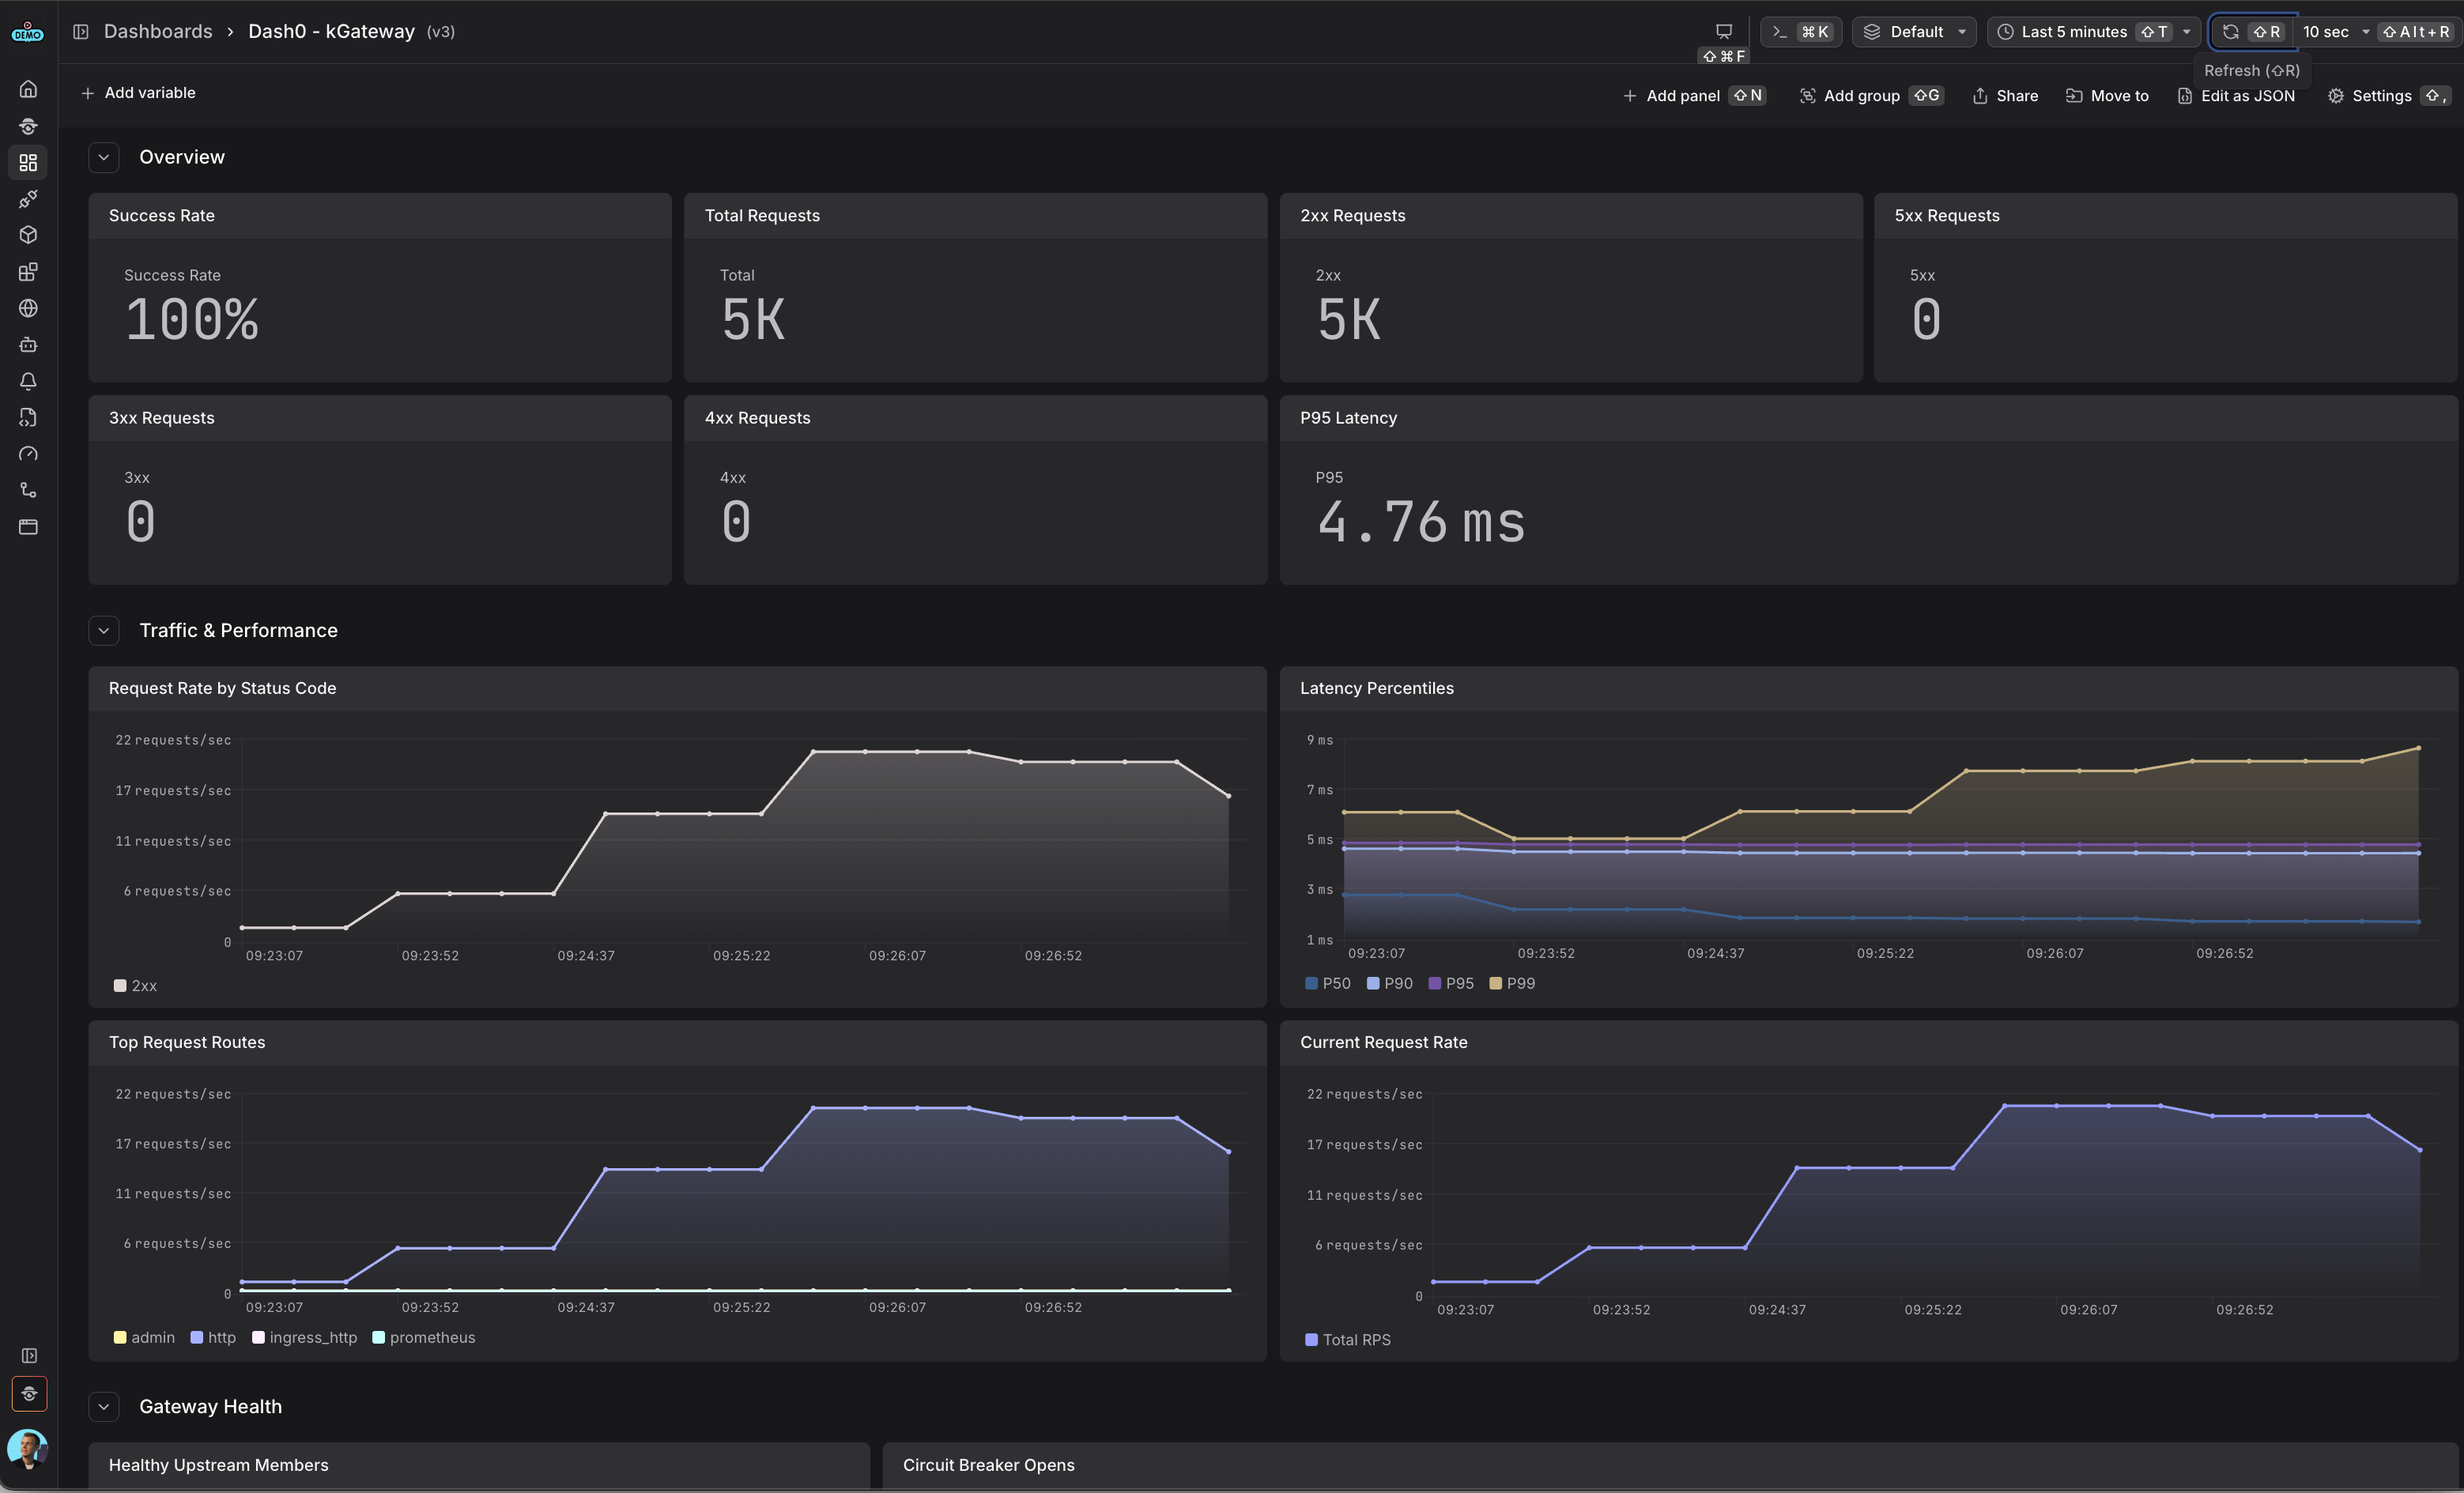
Monitor kGateway service request rates, latency percentiles, HTTP status codes, upstream health, and connection metrics
kgateway is a cloud-native API Gateway and AI Gateway built on Envoy Proxy that implements the Kubernetes Gateway API. It provides a modern, standards-based solution for managing ingress traffic in Kubernetes clusters with advanced routing, observability, and AI traffic management capabilities.
The Dash0 integration provides comprehensive observability for kgateway deployments using native OpenTelemetry instrumentation for distributed tracing, Prometheus metrics, and structured access logs with automatic trace correlation.
For more information, visit the kgateway Documentation.
Gain comprehensive visibility into your kgateway setup and optimize performance with the following observability features:
Use this integration to monitor ingress traffic, debug routing issues, analyze performance patterns, and ensure your Kubernetes Gateway API implementation operates reliably at scale.
kgateway includes native support for observability via OpenTelemetry distributed tracing (OTLP/gRPC), Prometheus metrics, and structured access logs using OTLP LogRecord format with automatic TraceID and SpanID correlation.
This integration uses the recommended pattern of deploying an OpenTelemetry Collector in your cluster to collect telemetry from kgateway and forward it to Dash0.
For more details, refer to the kgateway Documentation and Envoy Observability Documentation.
You'll need an OpenTelemetry Collector deployed in your cluster to collect telemetry from kgateway and forward it to Dash0.
For production environments, consider using one of these deployment methods:
Helm Chart for The OpenTelemetry Collector
For a complete working example with collector configuration, see the Dash0 kgateway Example.
The OpenTelemetry Collector needs specific configuration to collect all three signals from kgateway:
Configure the Collector to receive distributed traces and access logs from kgateway using the otlp receiver:
kgateway sends both traces and logs to the same OTLP receiver. Traces use W3C trace context propagation, and access logs are sent as OTLP LogRecords with automatic TraceID and SpanID correlation—no manual parsing or transformation needed.
Configure the Collector to scrape metrics from both the kgateway controller and proxy using the prometheus receiver:
Create an HTTPListenerPolicy to configure tracing and access logs for your Gateway:
Since the HTTPListenerPolicy in kgateway-system needs to reference the collector service in opentelemetry namespace, create a ReferenceGrant:
To verify that telemetry is flowing:
service.name = "kgateway-http"envoy_* and kgateway_* metrics