Dash0 Raises $110M Series B at $1B Valuation
Gain visibility into your Kubernetes environment with unified metrics and checks. Monitor nodes, pods, and containers for immediate issue detection.
Kubernetes has become a cloud-native operating system, and monitoring it and its workload is essential to operating your platform. With Dash0, you can gain detailed insights into your Kubernetes clusters. And because Dash0 fully embraces open standards and CNCF technologies, it is incredibly interoperable.
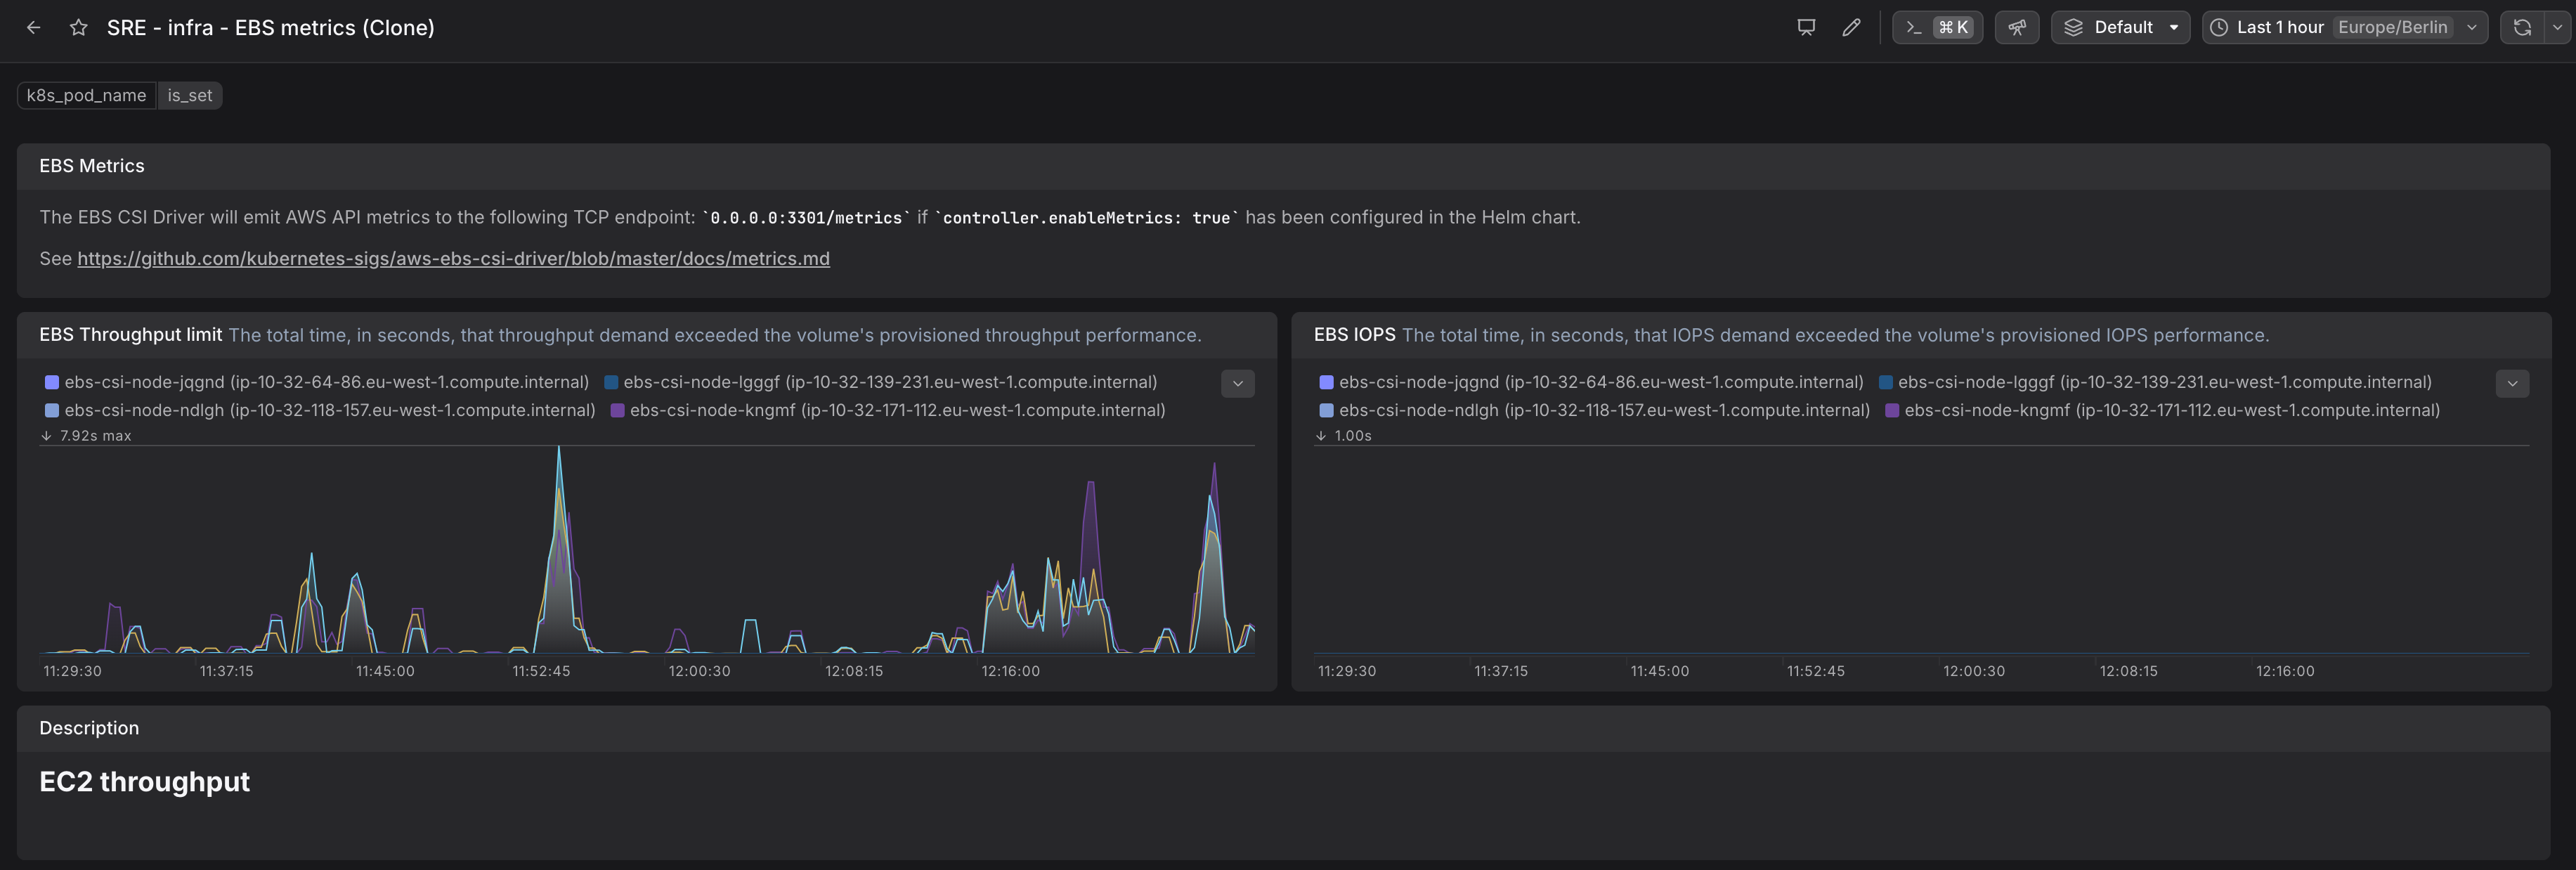
EBS CSI Driver IOPS and Throughput metrics for Kubernetes nodes.
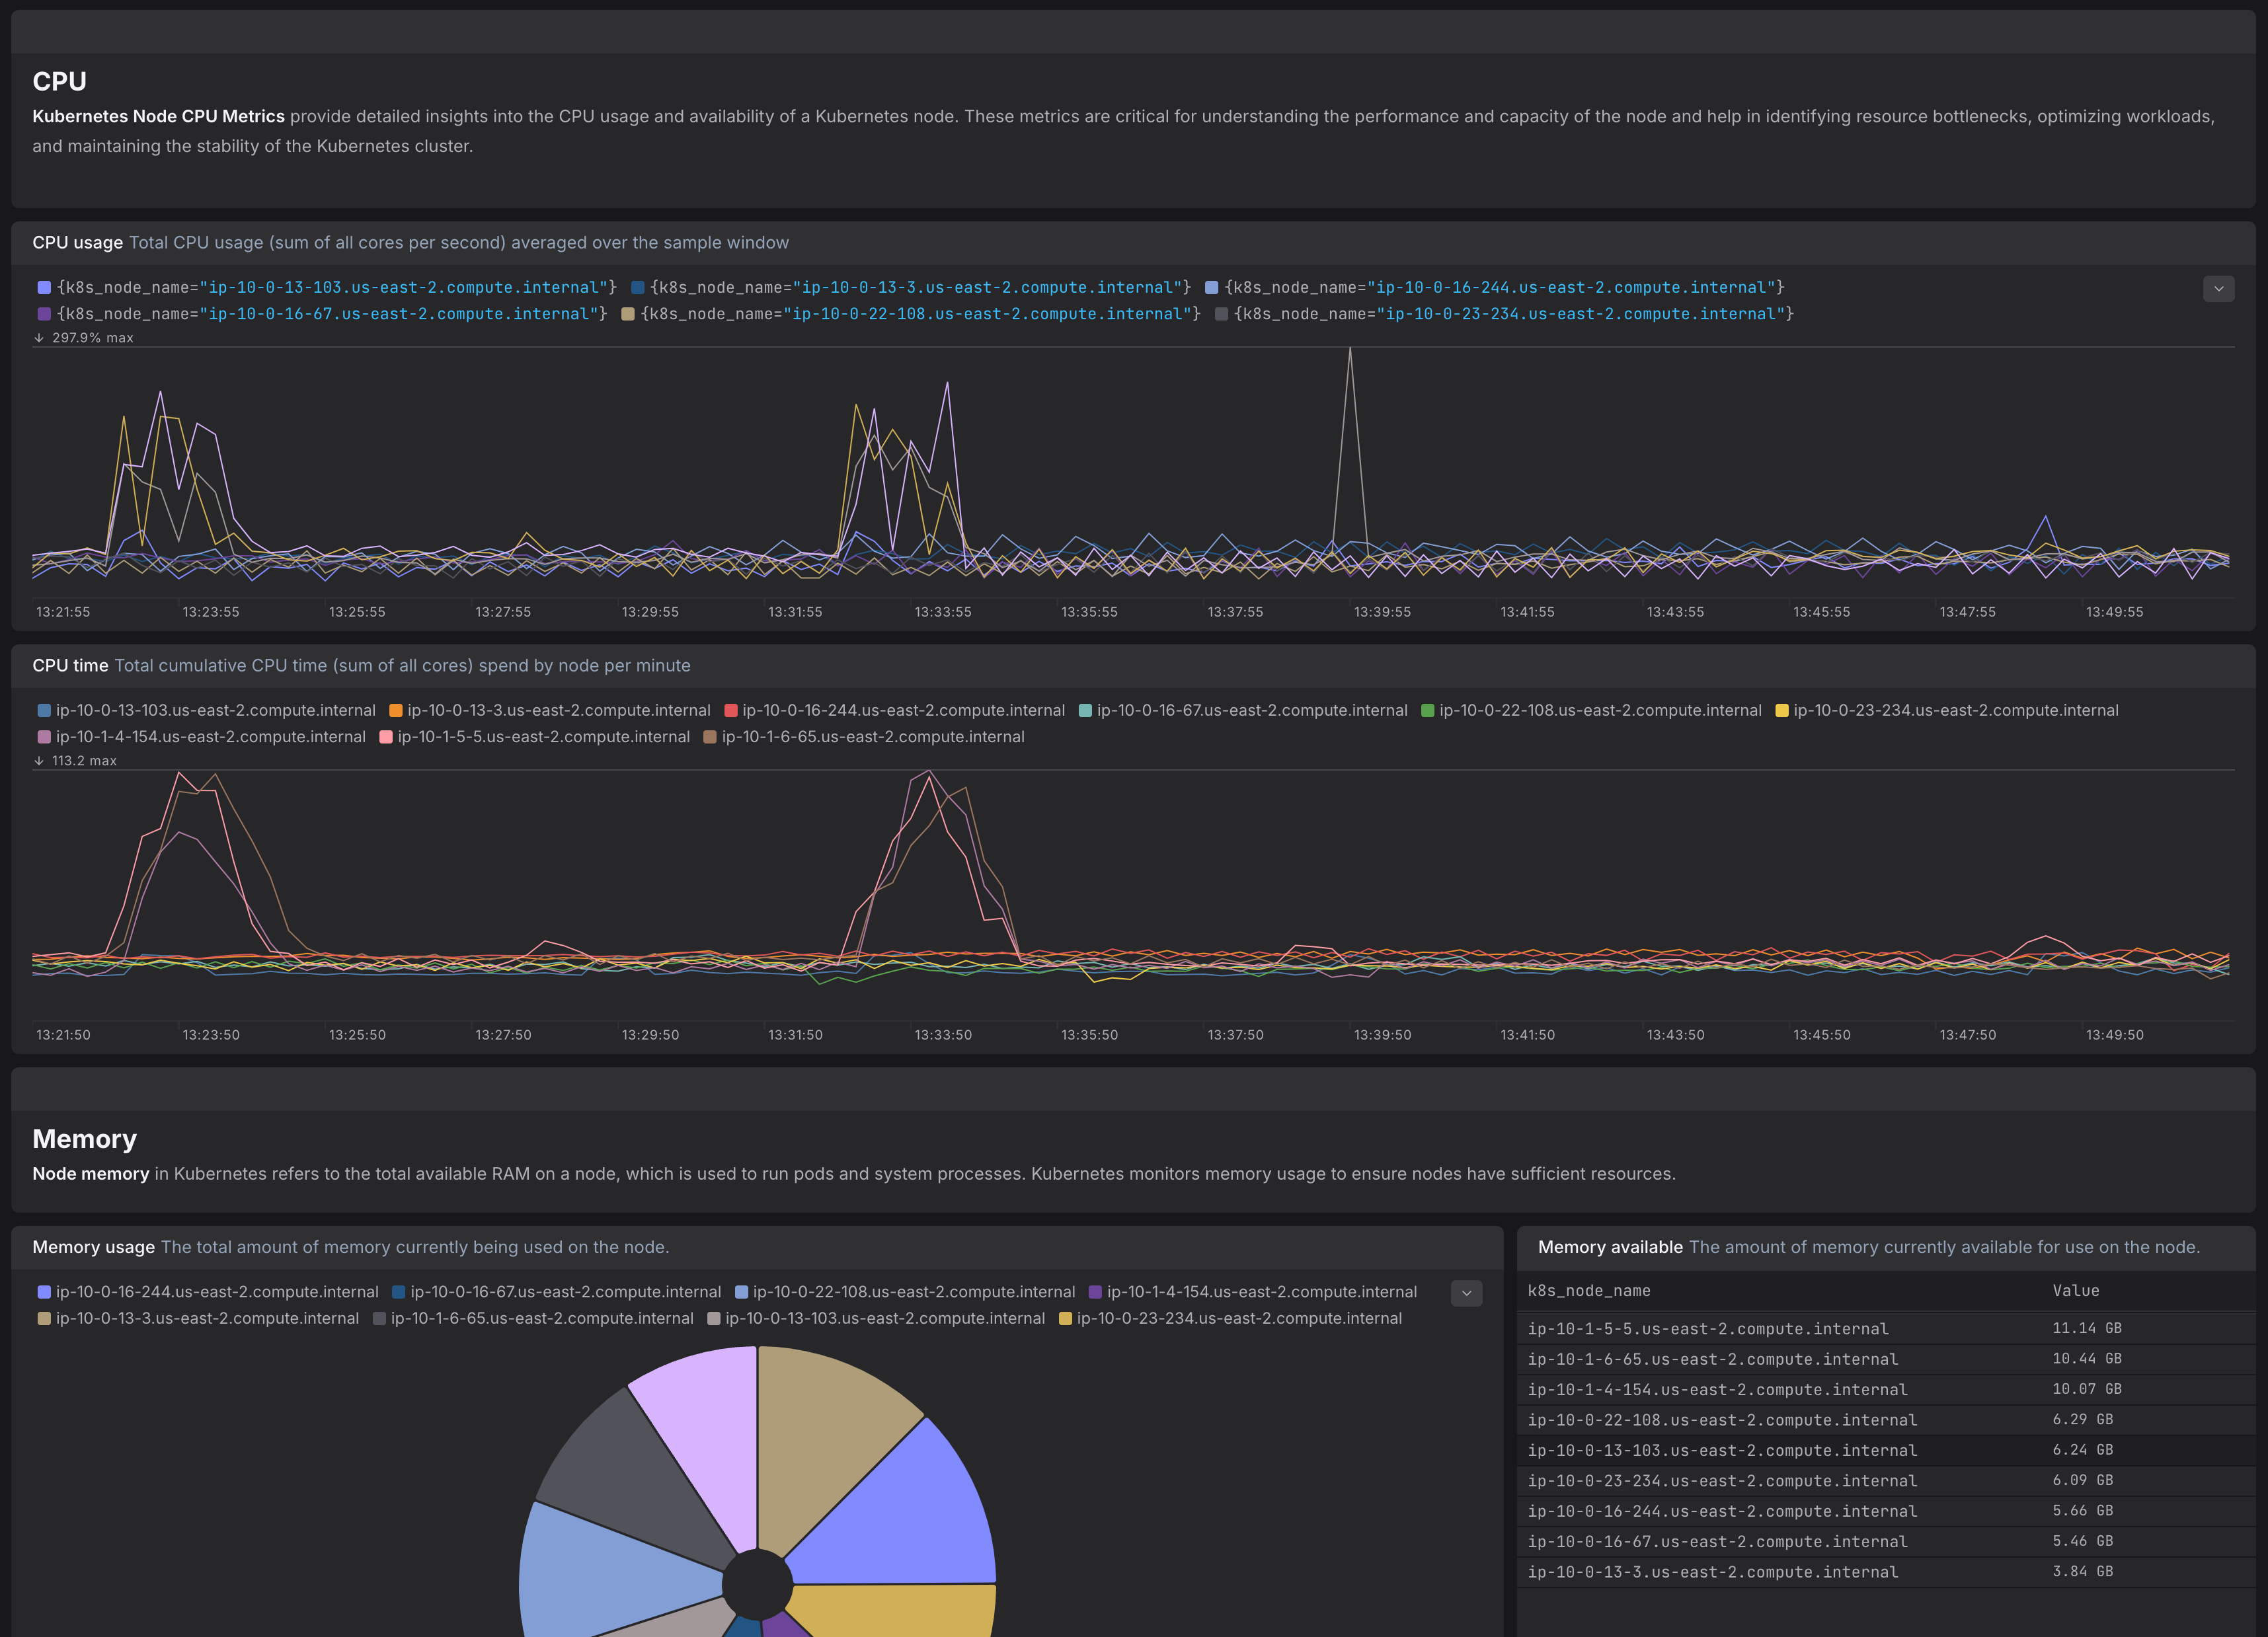
Kubernetes Node Metrics Dashboard - monitor CPU, memory, disk usage, and node health to optimize resource performance.
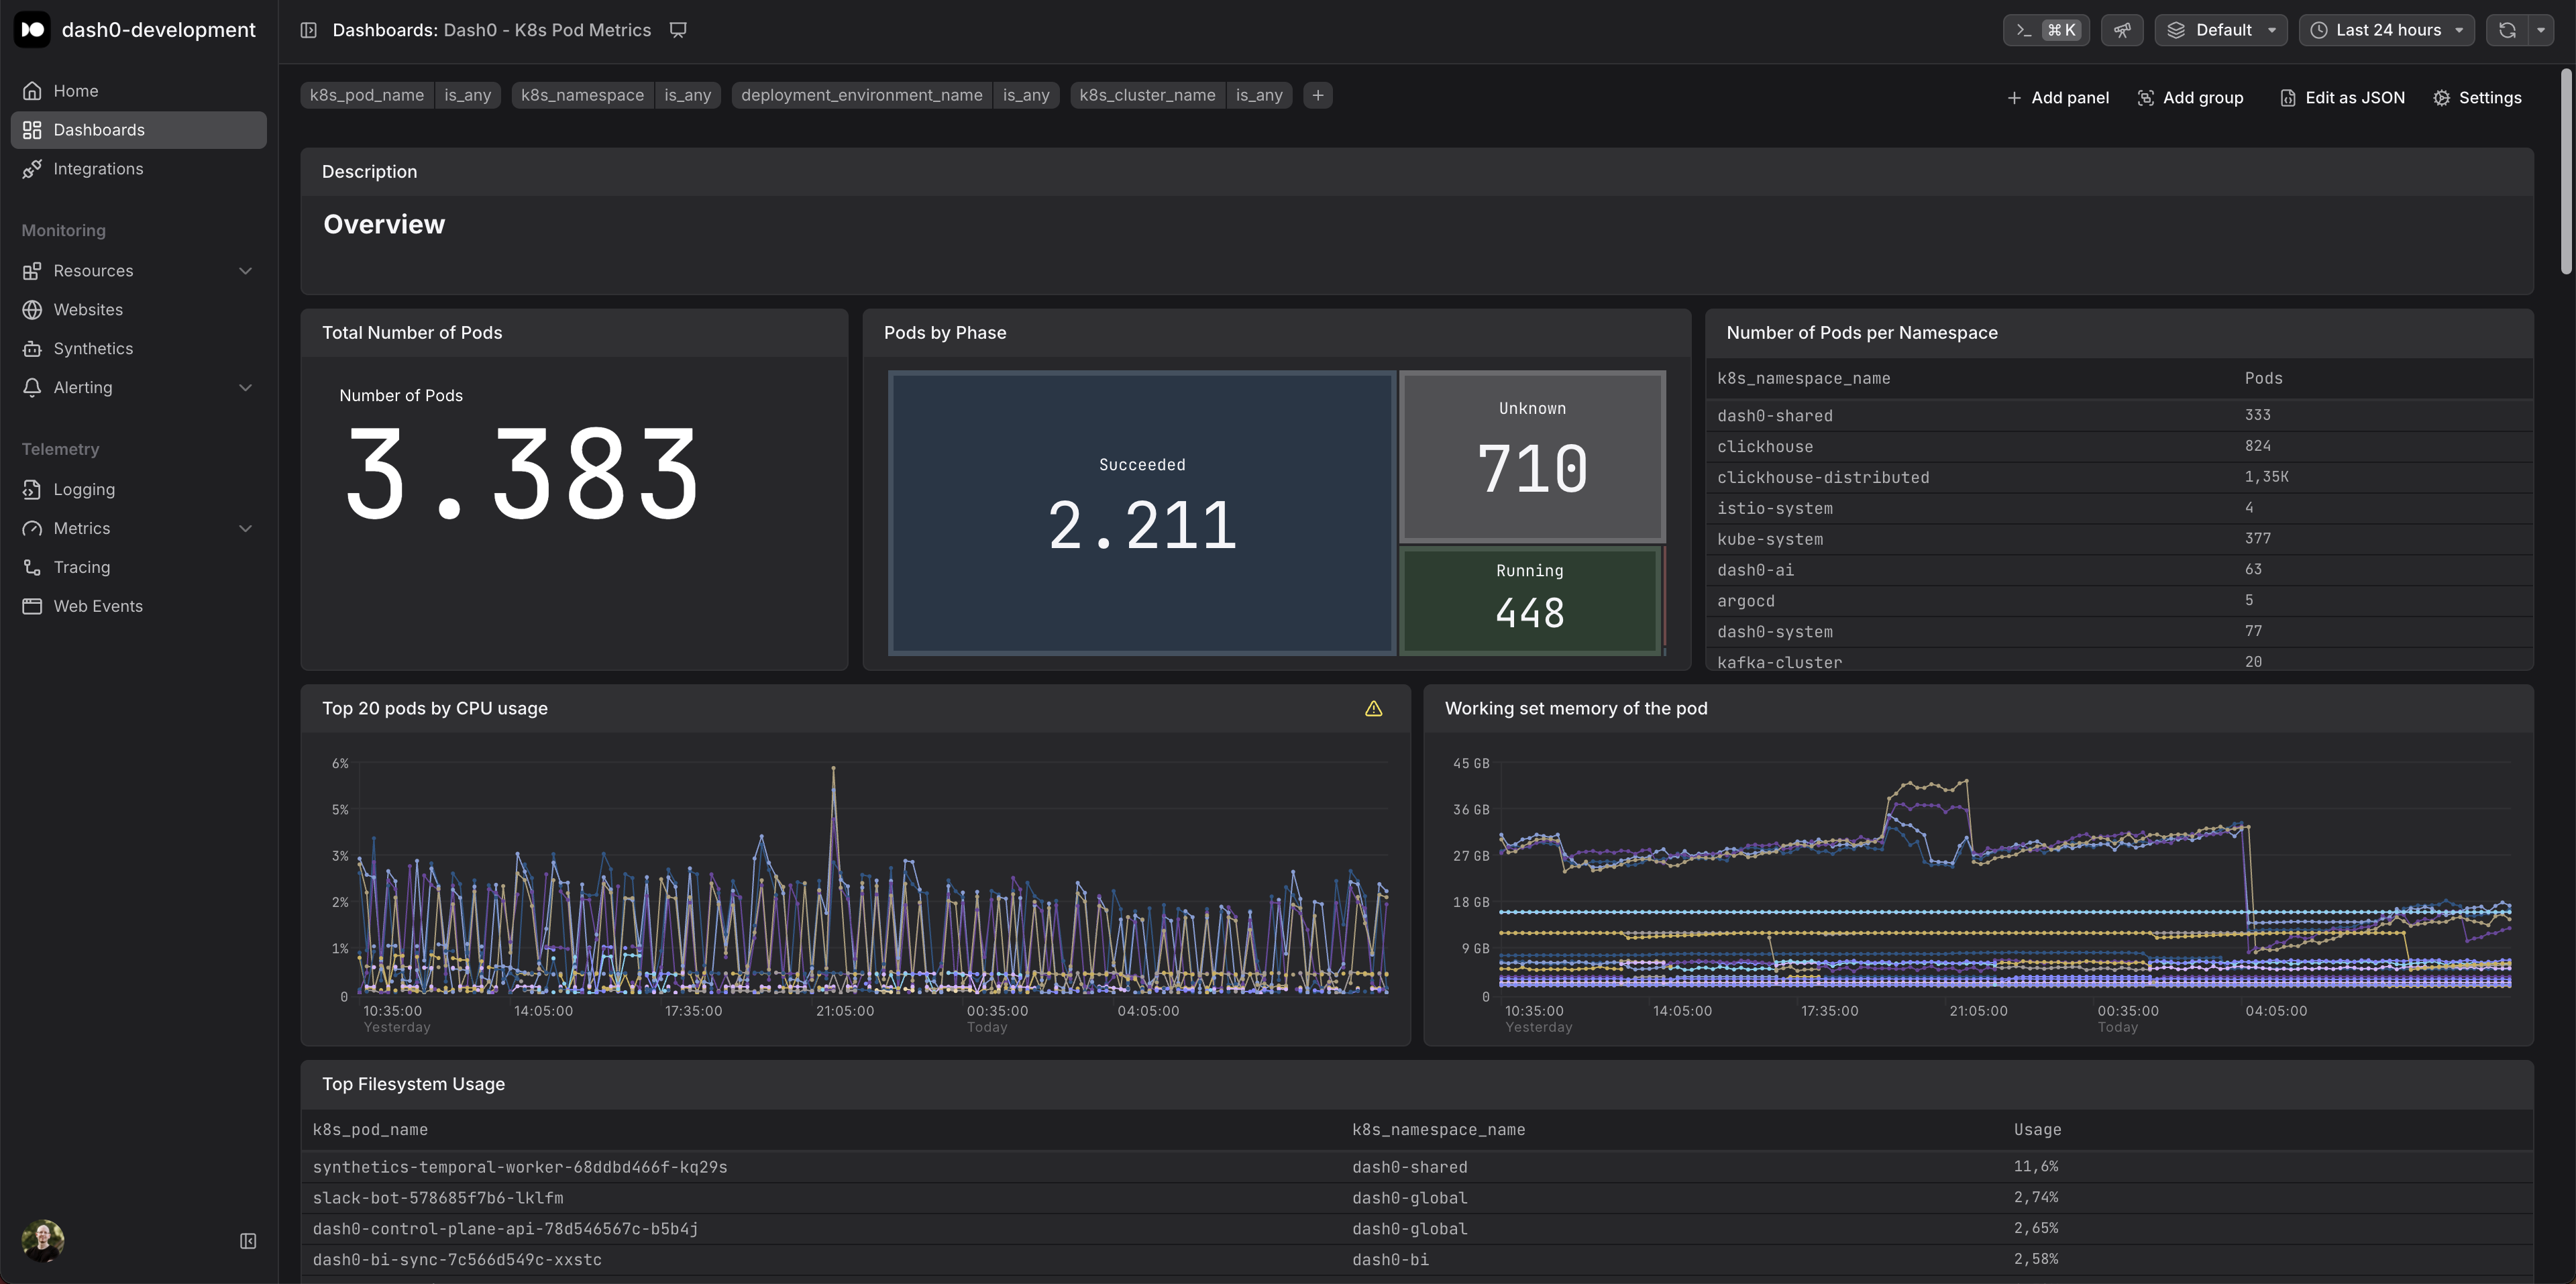
Kubernetes Pod Metrics Dashboard - monitor CPU, memory, disk usage, and pod health to optimize resource performance.
DaemonSet pods are misscheduled
A DaemonSet rollout is stuck
Deployment replicas mismatch
A Horizontal Pod Autoscaler has scaled to maximum
HPA {{ $labels.k8s_namespace_name }}/{{ $labels.k8s_hpa_name }} has scaled to maximum.
A Horizontal Pod Autoscaler is constantly underutilized
HPA {{ $labels.k8s_namespace_name }}/{{ $labels.k8s_hpa_name }} is constantly underutilized.
A Kubernetes Job failed to complete
Job {{ $labels.k8s_namespace_name }}/{{ $labels.k8s_job_name }} failed to complete.
A Kubernetes Job did not complete in time
Kubernetes Job {{ $labels.k8s_namespace_name }}/{{ $labels.k8s_job_name }} did not complete in time.
A Kubernetes node CPU usage is high
Node {{ $labels.k8s_node_name }} in cluster {{ $labels.k8s_cluster_name }} CPU usage is {{ $value }}%.
Monitors Kubernetes node CPU usage as percentage. This alert fires when node CPU usage exceeds the threshold:
Kubernetes node available filesystem space is below 10GB
Node has low available disk space (less than 10GB).
A Kubernetes node filesystem usage is high
Node {{ $labels.k8s_node_name }} in cluster {{ $labels.k8s_cluster_name }} filesystem usage is {{ $value }}.
Monitors Kubernetes node filesystem usage. This alert fires when the node's filesystem usage exceeds the threshold:
A Kubernetes node has low available memory
Node {{ $labels.k8s_node_name }} in cluster {{ $labels.k8s_cluster_name }} available memory is only {{ $value }}.
Node has low available memory (less than 2GB).
A Kubernetes node memory working set is high
Node {{ $labels.k8s_node_name }} in cluster {{ $labels.k8s_cluster_name }} memory working set is {{ $value }}.
Monitors Kubernetes node memory working set. This alert fires when the node's memory working set exceeds the threshold:
Working set represents memory pages currently in active use by the node.
A Kubernetes node has been unready for a long time
Node {{ $labels.k8s_node_name }} has been unready for a long time.
Node is not in Ready state.
A Kubernetes pod is in Failed state
Pod {{ $labels.k8s_namespace_name }}/{{ $labels.k8s_pod_name }} is in Failed state.
Monitors Kubernetes pods in Failed phase. This alert fires when a pod enters the "Failed" phase. Includes pod name and namespace in alert context.
A Kubernetes pod has been pending for more than 10 minutes
Pod {{ $labels.k8s_namespace_name }}/{{ $labels.k8s_pod_name }} has been pending for more than 10 minutes.
Monitors Kubernetes pods that remain in Pending phase for extended periods. This alert fires when a pod stays in "Pending" phase for more than 10 minutes. Includes pod name and namespace in alert context.
A Kubernetes pod is in Unknown state
Pod {{ $labels.k8s_namespace_name }}/{{ $labels.k8s_pod_name }} is in Unknown state.
Monitors Kubernetes pods in Unknown phase. This alert fires when a pod enters the "Unknown" phase for more than 5 minutes. Unknown phase typically indicates kubelet communication issues.
ReplicaSet replicas mismatch
A Kubernetes StatefulSet went down
StatefulSet does not match the expected number of replicas
A Kubernetes volume is expected to fill up within four days
{{ $labels.k8s_namespace_name }}/{{ $labels.k8s_volume_name }} is expected to fill up within four days. Currently {{ $value }} is available.
A Kubernetes volume is almost full (less than 10% left)
Dash0 provides native Kubernetes Views and Dashboards to help you monitor your clusters, workloads, and resource usage. These features rely on OpenTelemetry components and Kubernetes metadata following semantic conventions to ensure consistency across environments.
This setup guide outlines how to collect and export the required telemetry to power Dash0's Kubernetes integration.
To support all built-in Kubernetes views in Dash0, telemetry must be collected using a two-tier OpenTelemetry Collector deployment:
kubeletstatsk8s_clusterk8sattributesk8s.namespace.name, k8s.pod.name, k8s.resource.uid)Note: For the best experience in Dash0, we strongly recommend enriching telemetry with Kubernetes resource UIDs (e.g.,
k8s.pod.uid,k8s.node.uid, etc.). These ensure consistent identity and grouping across restarts or rescheduling. You can include them via thek8sattributesprocessor:
Dash0 supports multiple ways to deploy the telemetry pipeline:
Helm Chart for The OpenTelemetry Collector
Choose the method that best fits your environment.