Dash0 Logo
Infrastructure MonitoringLog ManagementApplication Performance ManagementDistributed TracingKubernetes MonitoringDashboardsAlertingService MapIntegrationsTransparent CostObservability as Code
PricingDocs
GuidesBlogKnowledgePodcastIntegrationsChangelog
Contact usMeet our TeamCareersSecurity
  • Book A Demo
  • Sign In
  • Start Free Trial
Book a demoSign in
Start Free Trial

Resources

  • Pricing
  • Blog
  • Knowledge
  • Integrations
  • Documentation
  • Glossary
  • OTelBin.io
  • Sitemap

Company

  • Our Team
  • Careers
  • Security

Contact

  • Contact us
  • GitHub
  • LinkedIn
  • X
  • YouTube
  • Dash0 Newsletter
Subscribe to our newsletter

Receive updates on OTelBin, Dash0, Observability, OpenTelemetry, and more.

  • Terms and Conditions
  • Privacy Policy
  • Data Processing Agreement
  • Vulnerability Disclosure

©2025 Dash0 Inc.

Hub/Kubernetes Cluster Autoscaler

Technology

Kubernetes Cluster Autoscaler

Dynamically scales a Kubernetes cluster to match workload needs, optimizing resource utilization and performance.

Overview

Overview

The Cluster Autoscaler works by continuously monitoring the cluster for two main conditions:

  • Unschedulable pods due to insufficient resources
  • Underutilized nodes for an extended period

When it detects unschedulable pods, it scales up the cluster by adding nodes to accommodate the workload. Conversely, when it identifies underutilized nodes, it scales down the cluster by removing them after migrating their pods to other nodes. This process helps optimize resource usage, improve performance, and reduce costs by ensuring the cluster maintains just enough capacity to handle current workloads without manual intervention

Setup

Option 1: Collect metrics via Prometheus scrape annotation

When deploying the Cluster Autoscaler, you can enable Prometheus metrics by adding the following annotations to the Cluster Autoscaler Helm chart.

For more details see cluster-autoscaler Helm chart.

Option 2: Collect metrics via Prometheus scrape configuration

If you are using Prometheus to scrape metrics from your Kubernetes cluster, you can configure Prometheus to scrape the cluster autoscaler metrics by adding the following configuration to your Prometheus configuration file.

You need to verify that the pod labels in the scrape configuration match the name of the cluster-autoscaler pod.

Dashboards

K8s Cluster Autoscaler Overview

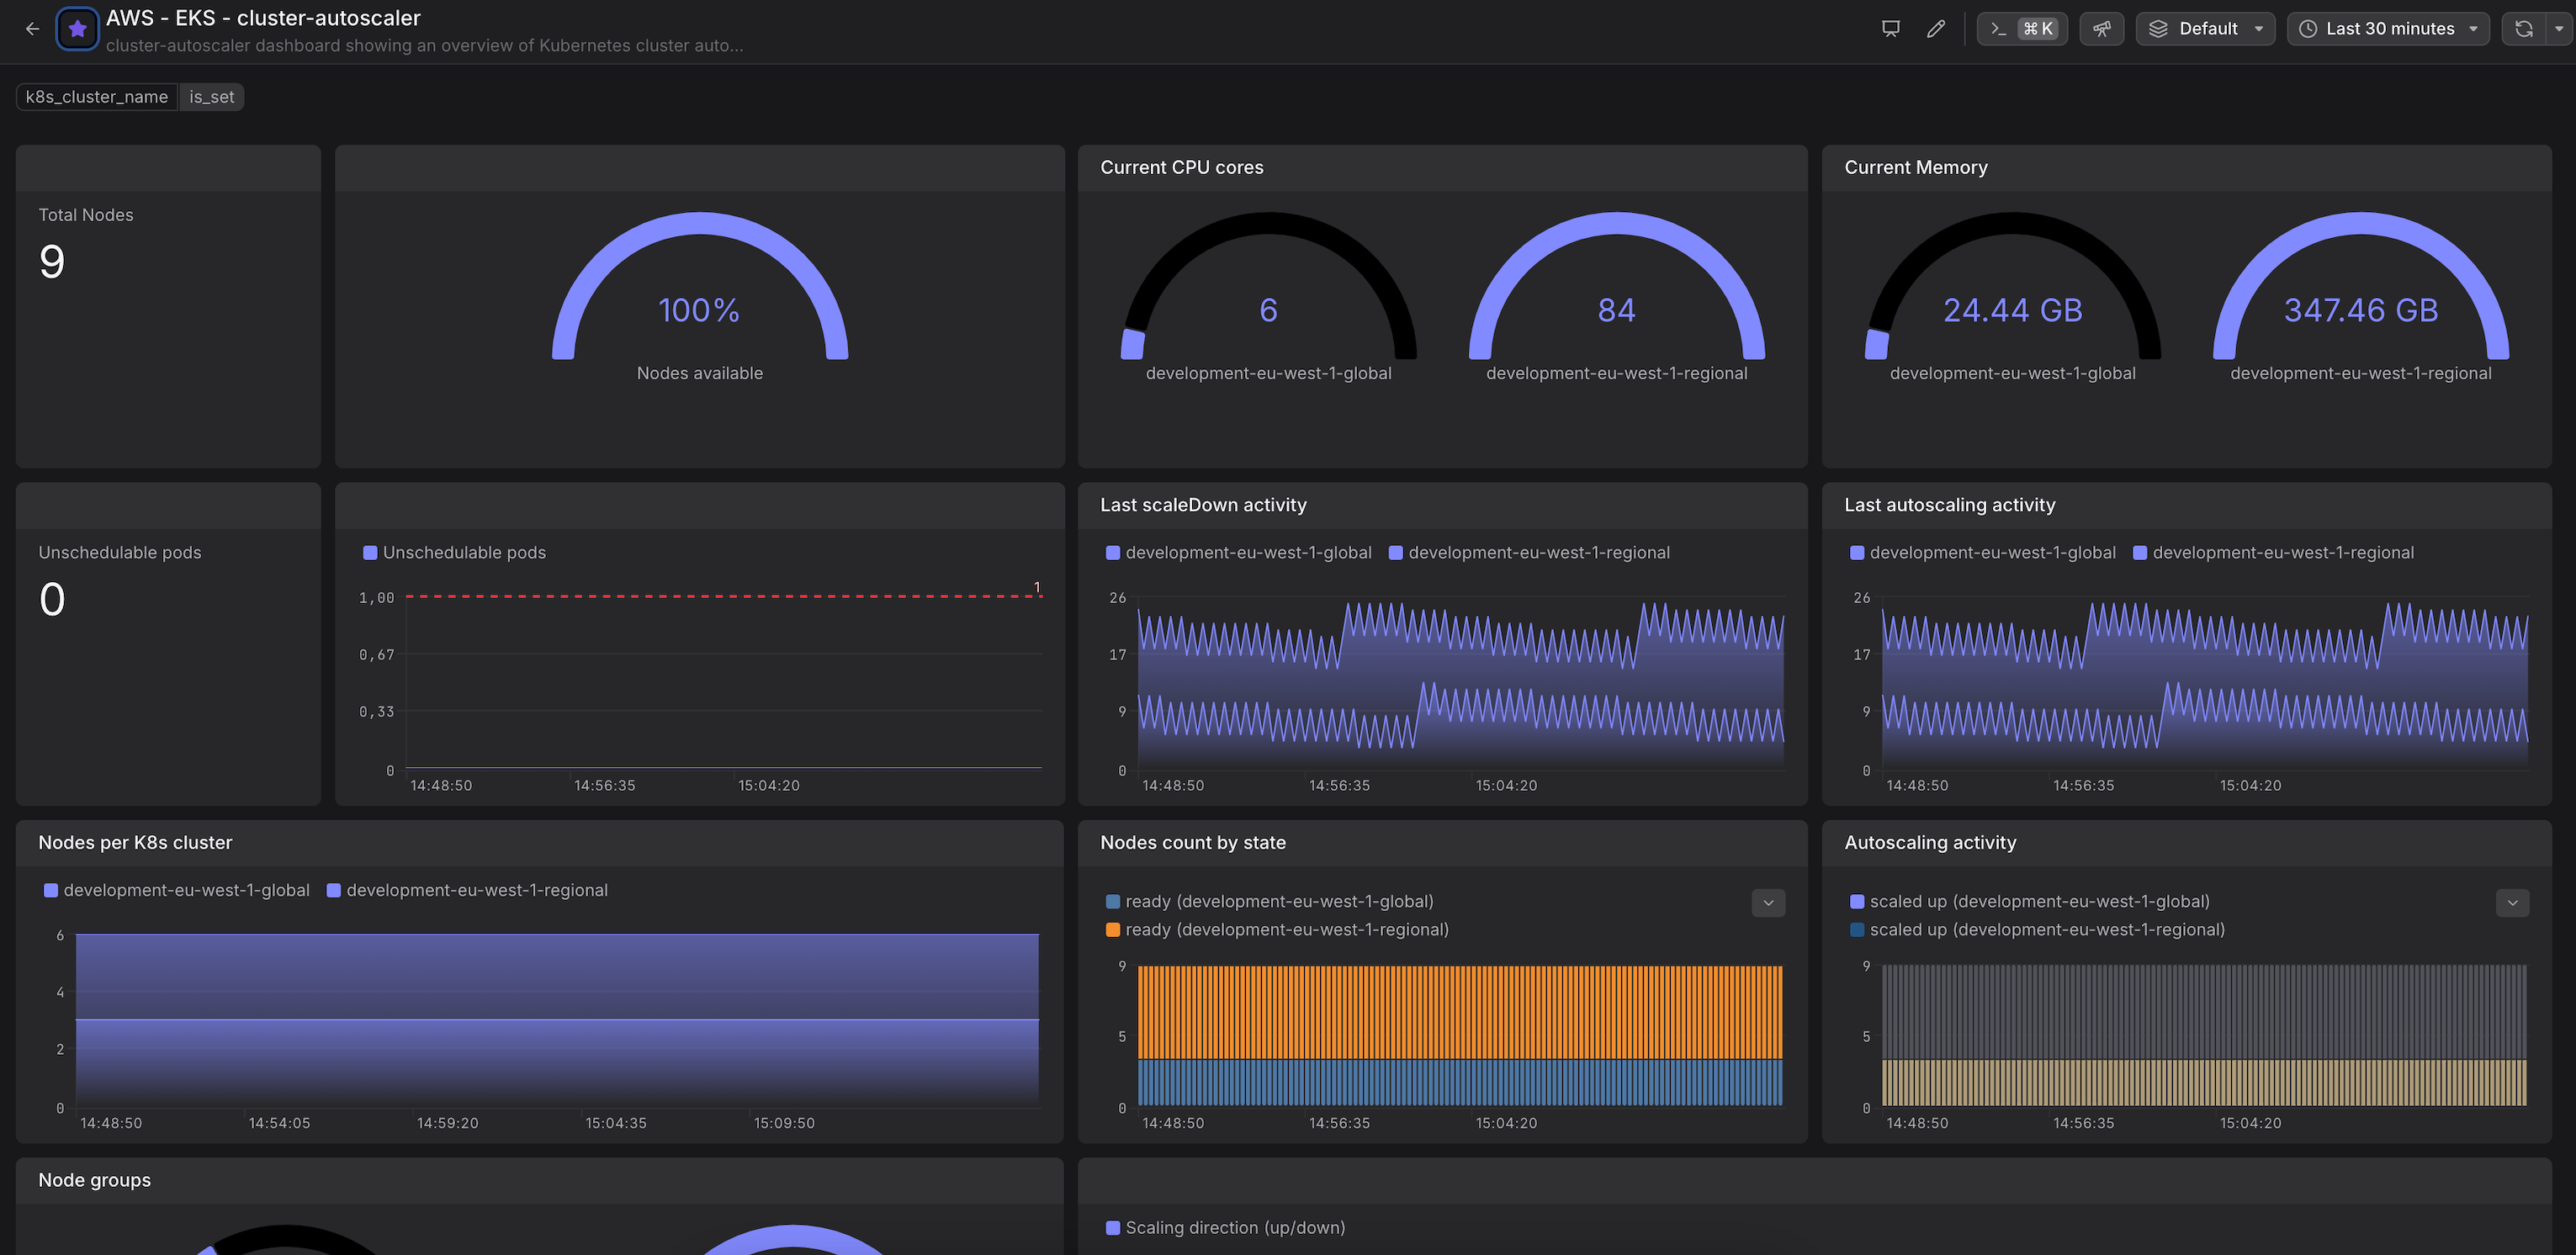
Dashboard with cluster-autoscaler metrics

[auto-scaler]
[k8s]
[prometheus]
cluster autoscaler metrics

Related Integrations

Kubernetes