Dash0 Raises $110M Series B at $1B Valuation
Monitor Ingress-NGINX Controller performance, traffic routing, and resource usage with OpenTelemetry metrics and distributed tracing.
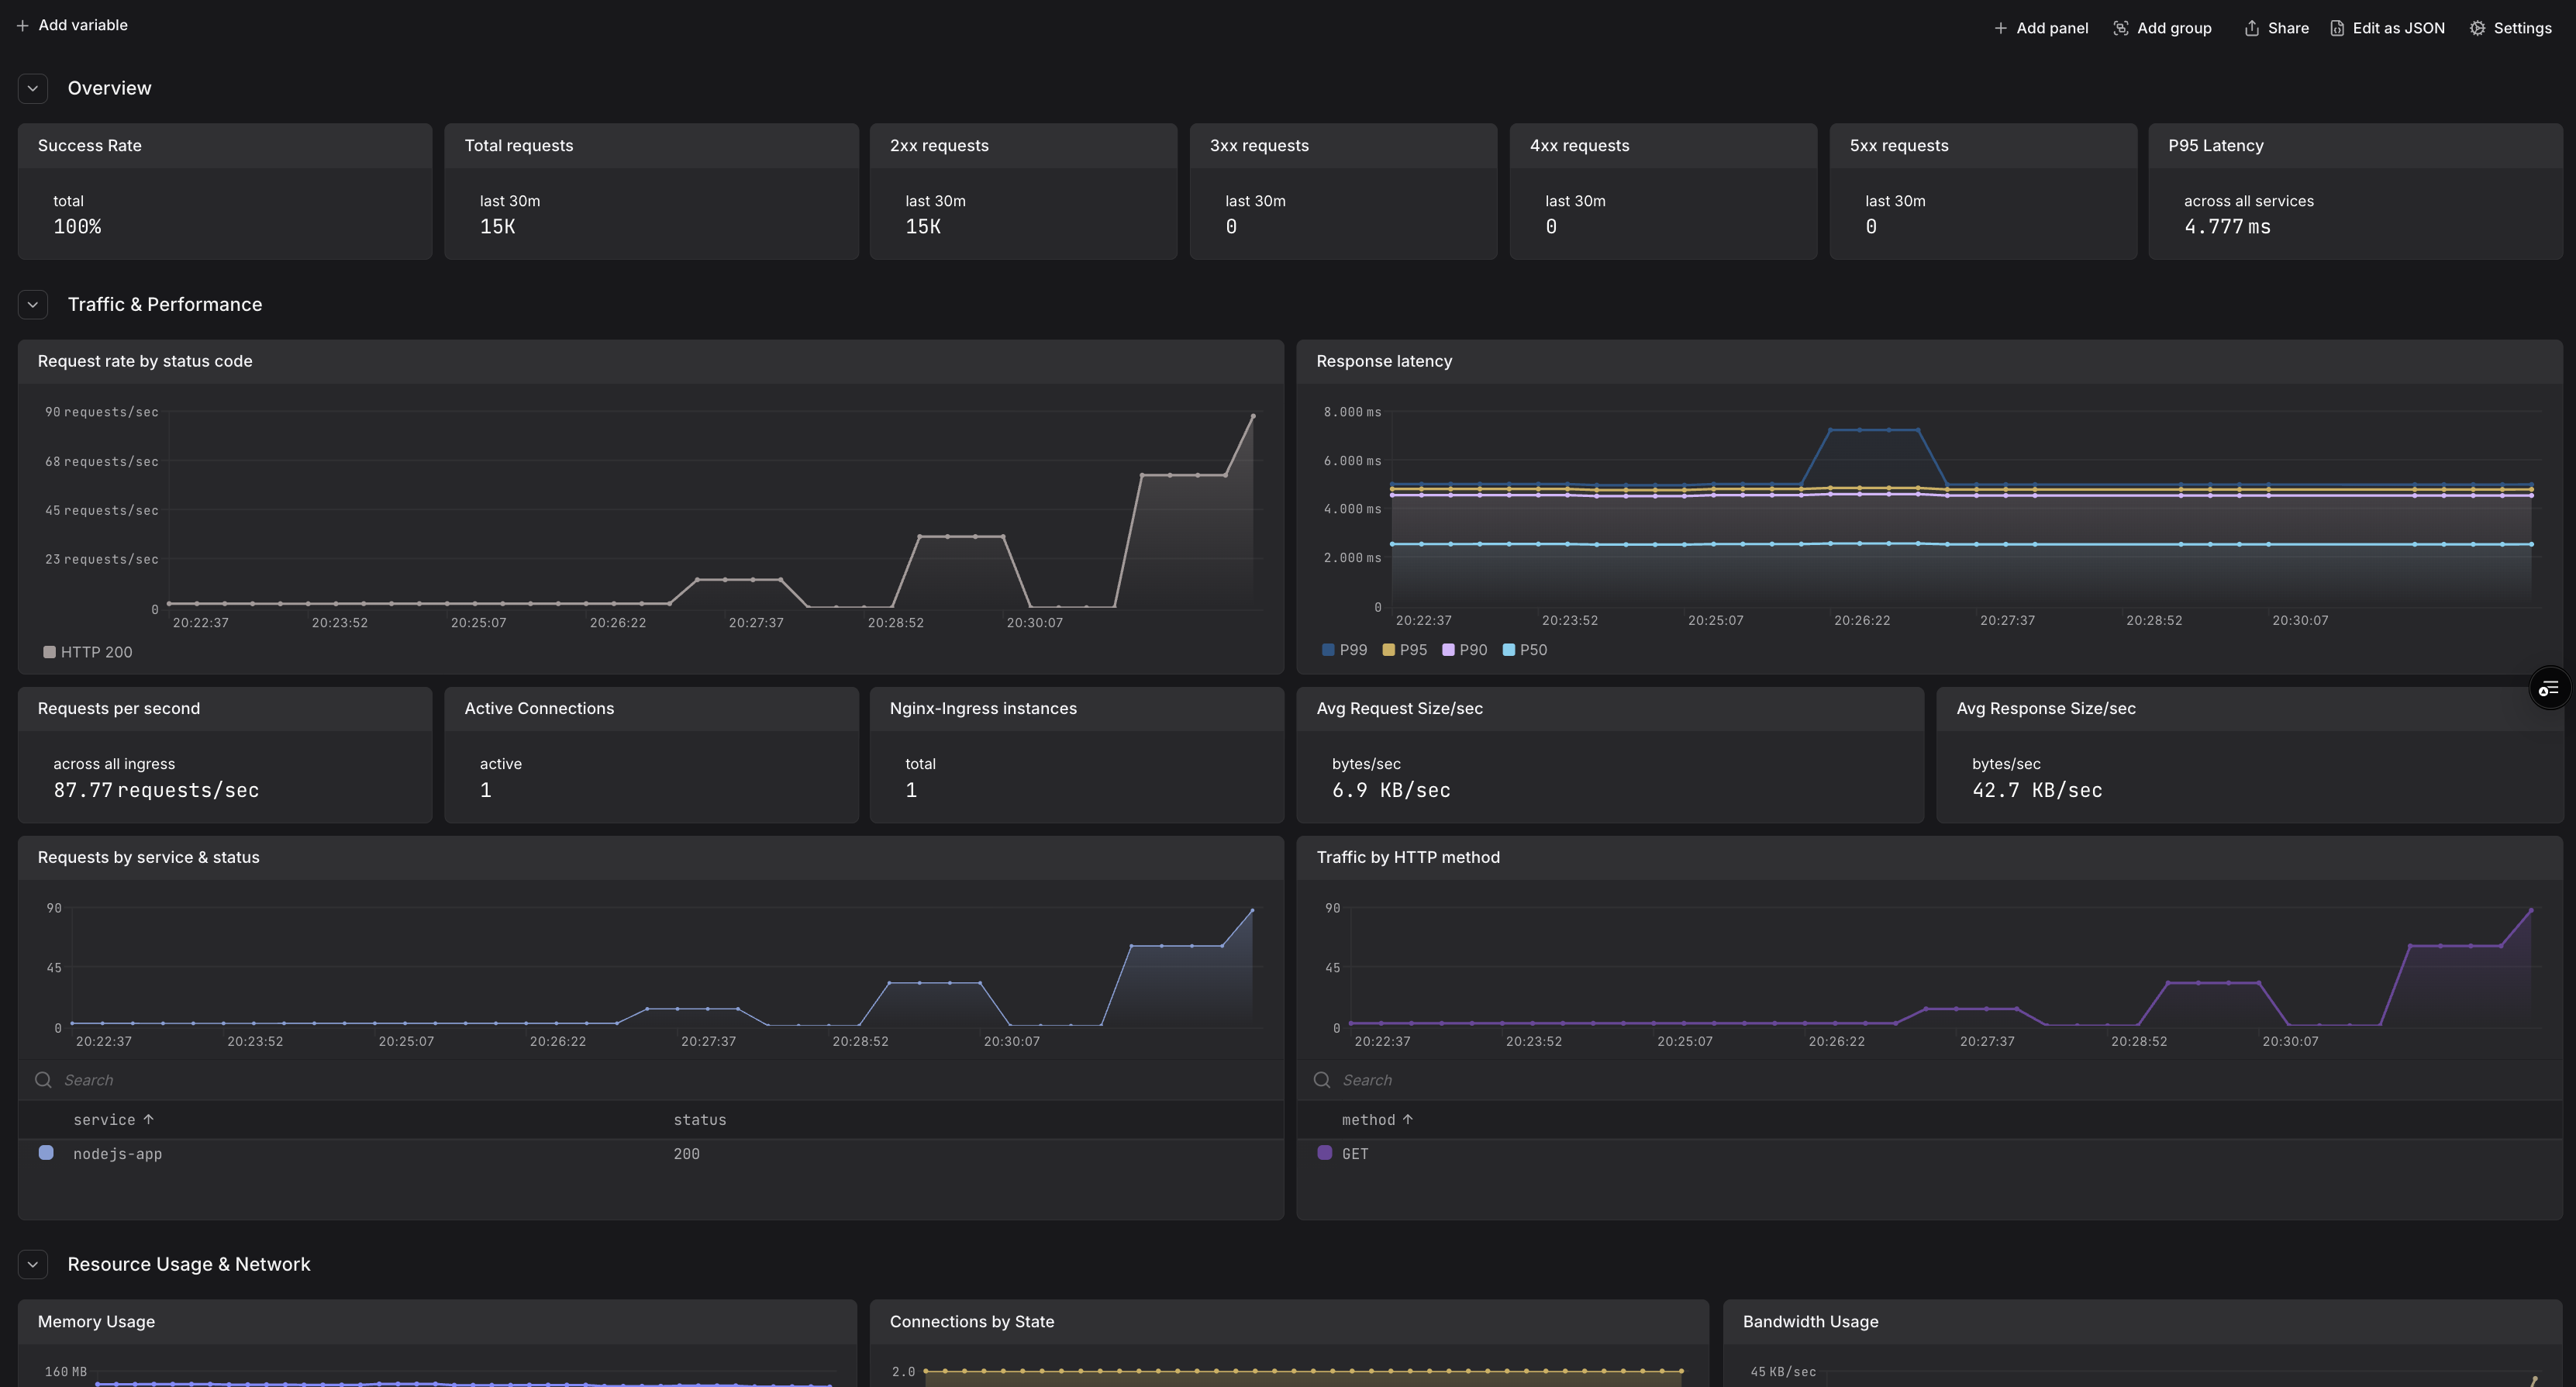
Ingress-NGINX monitoring dashboard showing request rates, latency percentiles, HTTP status codes, and active connections
Ingress-NGINX Controller is a Kubernetes ingress controller that uses NGINX as a reverse proxy and load balancer. It provides a robust, high-performance solution for managing ingress traffic in Kubernetes clusters with advanced routing, SSL termination, and load balancing capabilities.
The Dash0 integration provides comprehensive observability for Ingress-NGINX Controller deployments using OpenTelemetry-native instrumentation for distributed tracing, and prometheus metrics plus access logs with trace correlation.
For more information, visit the Ingress-NGINX Controller Documentation.
Gain comprehensive visibility into your Ingress-NGINX Controller setup and optimize performance with the following observability features:
Use this integration to monitor ingress traffic, debug routing issues, analyze performance patterns, and ensure your Kubernetes ingress layer operates reliably at scale.
Ingress-NGINX Controller includes built-in support for observability via OpenTelemetry metrics, distributed tracing, and structured access logs with trace correlation. This integration uses the recommended patterns of deploying an OpenTelemetry Collector in your cluster to collect telemetry from Ingress-NGINX Controller and forward it to Dash0.
For more details, refer to the Ingress-NGINX Controller OpenTelemetry Documentation.
You'll need an OpenTelemetry Collector deployed in your cluster to collect telemetry from Ingress-NGINX Controller and forward it to Dash0.
For production environments, consider using one of these deployment methods:
Helm Chart for The OpenTelemetry Collector
For a complete working example with collector configuration, see the Dash0 Ingress-NGINX Example.
values.yaml FileConfigure Ingress-NGINX Controller to export metrics and traces to an OpenTelemetry Collector in your cluster by storing the following configuration in a values.yaml file:
Note:
otlp-collector-host to match your OpenTelemetry Collector service endpointtrace_id and span_id for trace-logs correlationThis configuration enables:
Install or upgrade Ingress-NGINX Controller using the official Helm chart:
This installs Ingress-NGINX Controller with the specified configuration to export observability data to Dash0.
Ensure your OpenTelemetry Collector is configured to:
For trace-logs correlation, configure a transform processor in your collector to parse trace_id and span_id from the log format.
Once deployed, Ingress-NGINX Controller will send telemetry to the OpenTelemetry Collector, which then forwards to Dash0:
The OpenTelemetry Collector acts as a central aggregation point, handling authentication with Dash0 and providing additional processing capabilities like sampling, filtering, and trace-logs correlation.
For more details, refer to the Ingress-NGINX Controller Monitoring and OpenTelemetry documentation.
For a complete working example with Ingress-NGINX Controller, OpenTelemetry Collector, and demo applications, see the Dash0 Ingress-NGINX Example.