Dash0 Raises $110M Series B at $1B Valuation
Monitor HAProxy load balancer and proxy performance, including connection rates, request queuing, session counts, and backend server health.
HAProxy is a widely-used open-source load balancer and proxy server for TCP and HTTP-based applications. It is known for its high performance, reliability, and rich feature set for routing and distributing traffic across backend servers — from small deployments to large-scale infrastructure handling millions of connections.
Monitoring HAProxy is essential for understanding traffic distribution, detecting backend failures early, and ensuring your load balancing layer is not itself a bottleneck. The Dash0 integration collects metrics directly from HAProxy's stats interface via the OpenTelemetry Collector.
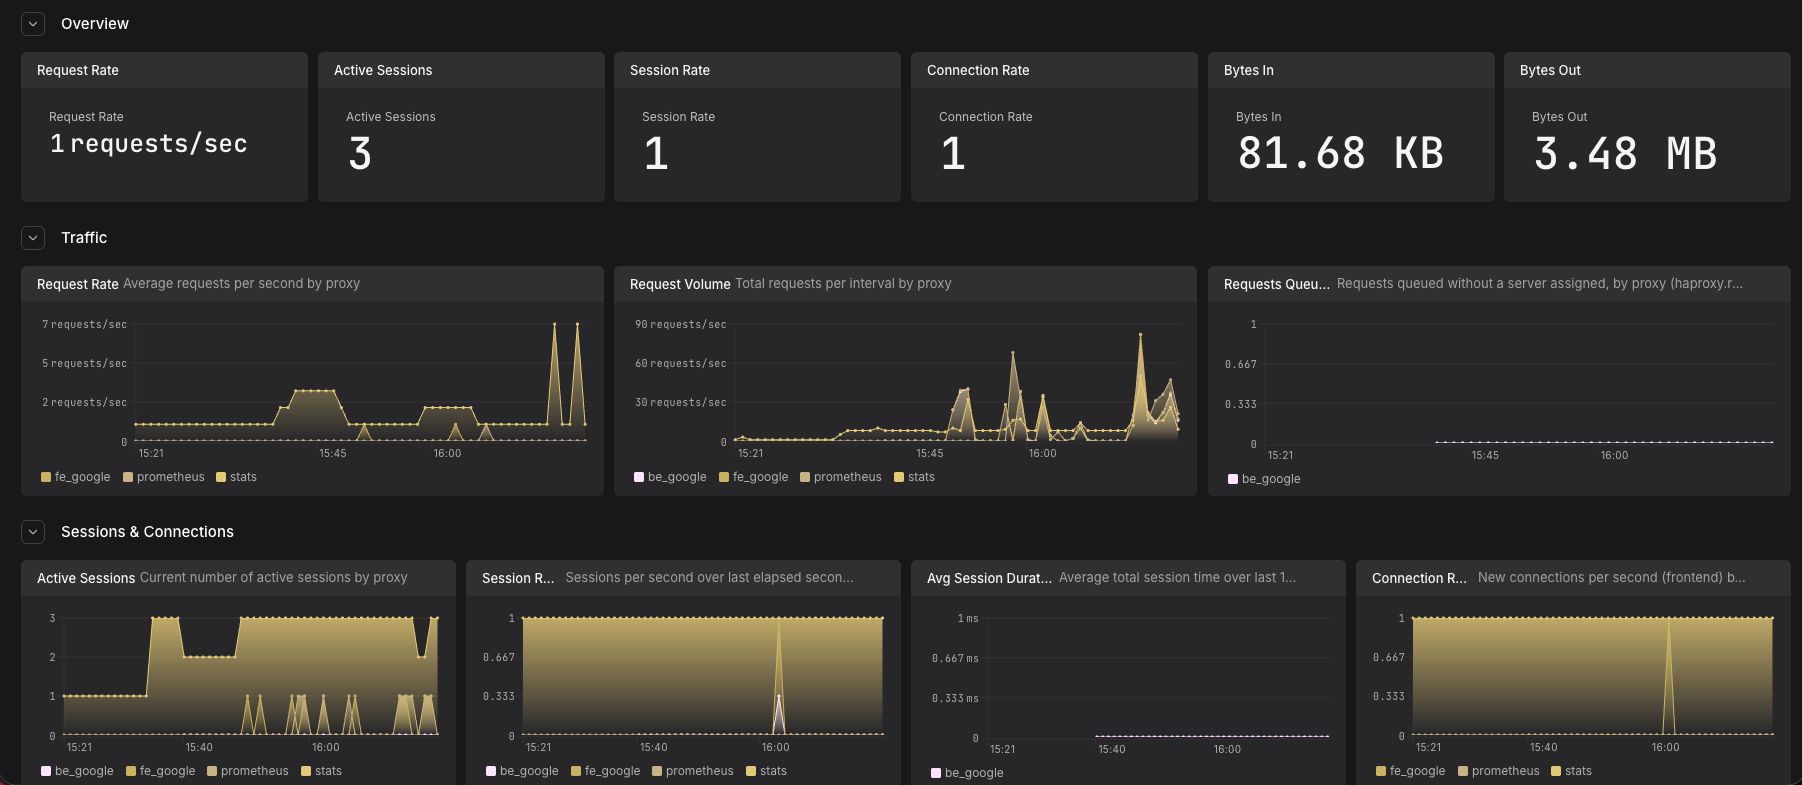
HAProxy monitoring dashboard covering traffic, sessions, connections, bandwidth, and error rates
The OpenTelemetry Collector's HAProxy receiver polls HAProxy periodically through either a Unix domain socket or an HTTP stats URL, collecting metrics about frontends, backends, and server health. The collector then forwards these metrics to Dash0.
Before setting up HAProxy monitoring, ensure:
You'll need an OpenTelemetry Collector deployed in your environment. Consider using:
The receiver requires HAProxy's stats interface to be enabled. Choose one of the following approaches:
Add the following to the global section of your haproxy.cfg:
Add a dedicated stats frontend to your haproxy.cfg:
Restart HAProxy after making configuration changes:
Add the HAProxy receiver to your OpenTelemetry Collector configuration:
Wire the receiver into a pipeline:
endpoint (required): Path to the HAProxy stats interface. Use file:// prefix for a Unix socket or a full HTTP URL for the stats page.collection_interval: How often to poll HAProxy for metrics. Default: 1m.initial_delay: Delay before the first collection. Default: 1s.metrics: Optionally enable or disable individual metrics. All 17 default metrics are enabled automatically.For all available options, see the HAProxy receiver documentation.
If using a Unix socket in Kubernetes, mount the socket path as a hostPath volume in your collector DaemonSet:
For most Kubernetes setups, the HTTP stats page approach (Option B) is simpler.
haproxy.*haproxy.requests.total — cumulative request count per backendhaproxy.sessions.count — current active sessionshaproxy.connections.rate — new connections per secondhaproxy.bytes.input / haproxy.bytes.output — traffic throughputhaproxy.responses.errors — backend error responses