Technology
Envoy
Monitor Envoy proxy traffic, cluster health, access logs, and traces with OpenTelemetry in Dash0.
Overview
Overview
Envoy is a high-performance, open-source edge and service proxy used as the data plane for API gateways, ingress controllers, and service meshes such as Istio and Contour. Because it sits on the request path for the traffic it handles, its own health is a direct signal of the reliability of everything behind it.
Envoy exposes detailed Prometheus-format statistics through its admin interface, supports structured access logs, and includes a native OpenTelemetry tracer, so the Dash0 integration can collect metrics, logs, and traces without a sidecar or extra agent, using only the OpenTelemetry Collector.
Use Cases
- Monitor Request Rates and Errors: Track request volume, response codes, and error rates across listeners and clusters to catch regressions early.
- Track Cluster Health and Retries: Observe upstream cluster membership, connection pool saturation, and retry counts to identify unhealthy backends before they cause outages.
- Analyze Traces and Access Logs: Correlate Envoy's native OpenTelemetry traces with structured access logs to investigate individual requests end to end.
- Understand Resource Usage: Monitor Envoy's own memory usage and active connections to plan capacity for the proxy layer itself.
Setup
Overview
Envoy collects Prometheus-format statistics through its admin interface, and can send access logs and traces directly over OTLP using its built-in OpenTelemetry access logger and tracer. This guide configures an OpenTelemetry Collector to scrape Envoy's stats and receive its native OTLP telemetry, then forwards everything to Dash0.
Prerequisites
Before setting up Envoy monitoring, ensure:
- Envoy is running and its admin interface is reachable from the collector.
- You control (or can propose changes to) Envoy's bootstrap or xDS configuration, since access logs and traces require additions to the listener configuration.
You'll need an OpenTelemetry Collector deployed. Consider using:
- Dash0 operator for Kubernetes (recommended)
- OpenTelemetry Operator for Kubernetes
-
Helm Chart for The OpenTelemetry Collector
Collector Configuration
Metrics
Configure the collector to scrape Envoy's admin stats endpoint with the prometheus receiver:
receivers:
  prometheus:
    config:
      scrape_configs:
        - job_name: "envoy"
          scrape_interval: 15s
          metrics_path: /stats/prometheus
          static_configs:
            - targets: ["envoy:9901"]
Replace the target with the address of Envoy's admin interface. In Kubernetes, this is typically the pod IP or a headless service pointing at the admin port.
Traces and access logs
Envoy sends traces and access logs directly to a collector over gRPC, so the same collector also needs an otlp
receiver:
receivers:
  otlp:
    protocols:
      grpc:
        endpoint: 0.0.0.0:4317
Configure Envoy for Traces and Access Logs
Add a cluster in Envoy's configuration that points at the OpenTelemetry Collector's OTLP/gRPC endpoint:
clusters:
  - name: otel_collector
    connect_timeout: 1s
    type: STRICT_DNS
    lb_policy: ROUND_ROBIN
    typed_extension_protocol_options:
      envoy.extensions.upstreams.http.v3.HttpProtocolOptions:
        "@type": type.googleapis.com/envoy.extensions.upstreams.http.v3.HttpProtocolOptions
        explicit_http_config:
          http2_protocol_options: {}
    load_assignment:
      cluster_name: otel_collector
      endpoints:
        - lb_endpoints:
            - endpoint:
                address:
                  socket_address: { address: otel-collector, port_value: 4317 }
Then, on the listener's HTTP connection manager, enable the native OpenTelemetry tracer:
tracing:
  provider:
    name: envoy.tracers.opentelemetry
    typed_config:
      "@type": type.googleapis.com/envoy.config.trace.v3.OpenTelemetryConfig
      grpc_service:
        envoy_grpc:
          cluster_name: otel_collector
      service_name: my-envoy
And the OpenTelemetry access logger:
access_log:
  - name: envoy.access_loggers.open_telemetry
    typed_config:
      "@type": type.googleapis.com/envoy.extensions.access_loggers.open_telemetry.v3.OpenTelemetryAccessLogConfig
      common_config:
        log_name: envoy-access-log
        transport_api_version: V3
        grpc_service:
          envoy_grpc:
            cluster_name: otel_collector
      body:
        kvlist_value:
          values:
            - key: method
              value:
                string_value: "%REQ(:METHOD)%"
            - key: path
              value:
                string_value: "%REQ(:PATH)%"
            - key: response_code
              value:
                string_value: "%RESPONSE_CODE%"
            - key: duration_ms
              value:
                string_value: "%DURATION%"
Using a kvlist_value body produces a structured log record instead of a single formatted string, so each field stays queryable on its own. Adjust service_name and the fields in body to match your own naming and the request data you care about.
Verification
- Check collector logs for successful scrapes and no export errors.
- Navigate to Metrics Explorer in Dash0 and search for metrics with prefix
envoy_. - Navigate to Logging and filter for the
service.nameyou configured to confirm access logs are arriving. - Navigate to Tracing and confirm spans named
ingress(or your configured operation name) appear for requests that pass through Envoy.
References
Dashboards
Envoy Overview
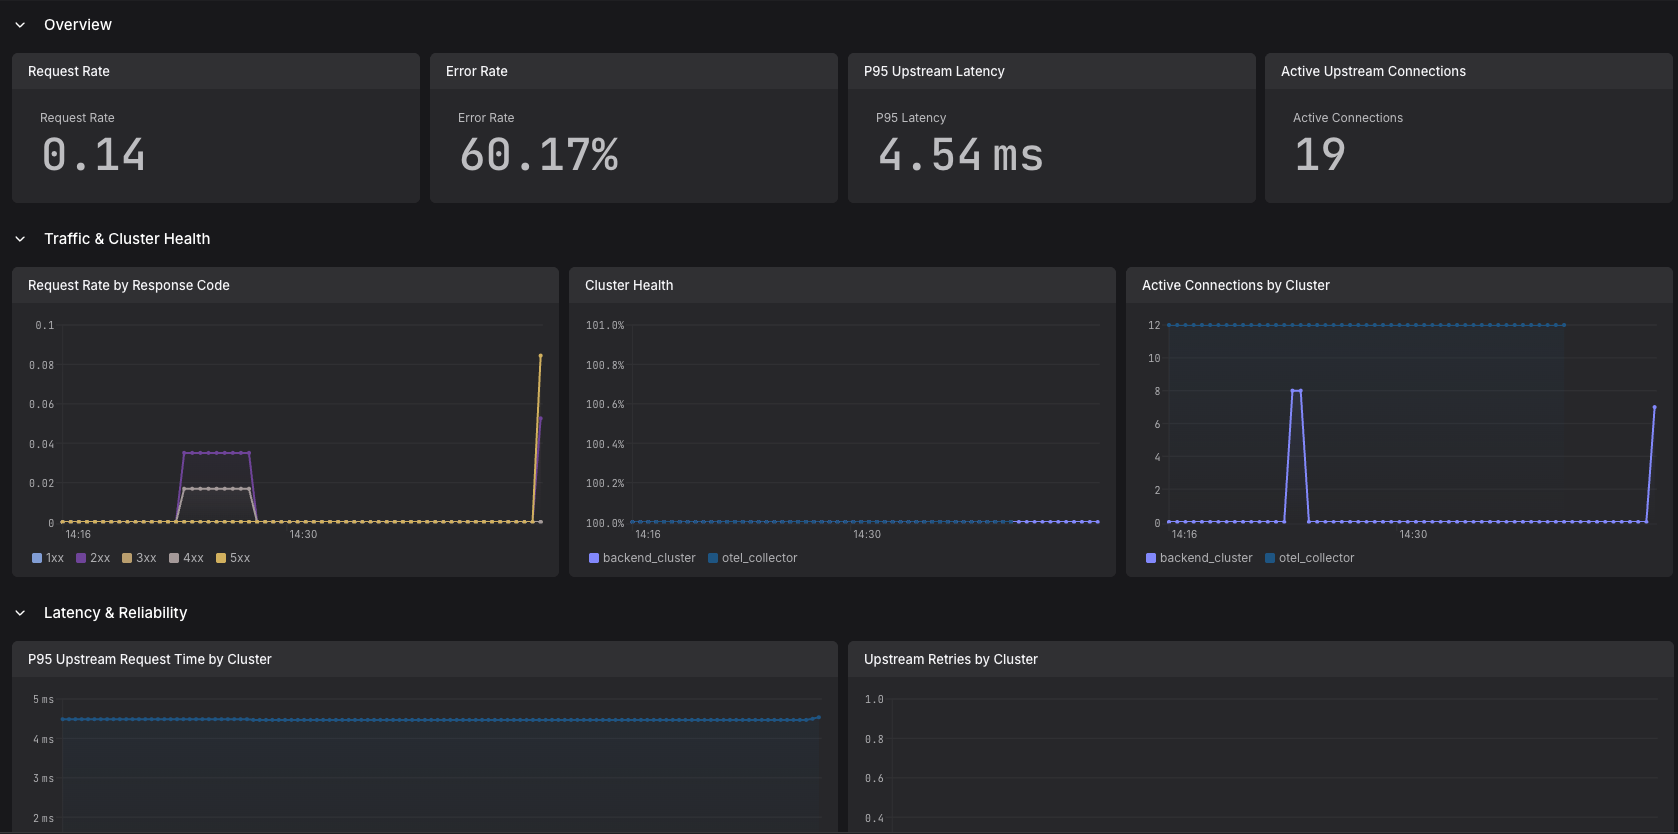
Envoy monitoring dashboard covering request rate, errors, cluster health, connections, retries, and memory