Dash0 Raises $110M Series B at $1B Valuation
Monitor Emissary-ingress ingress controller performance, request routing, and traffic patterns with OpenTelemetry metrics and distributed tracing.
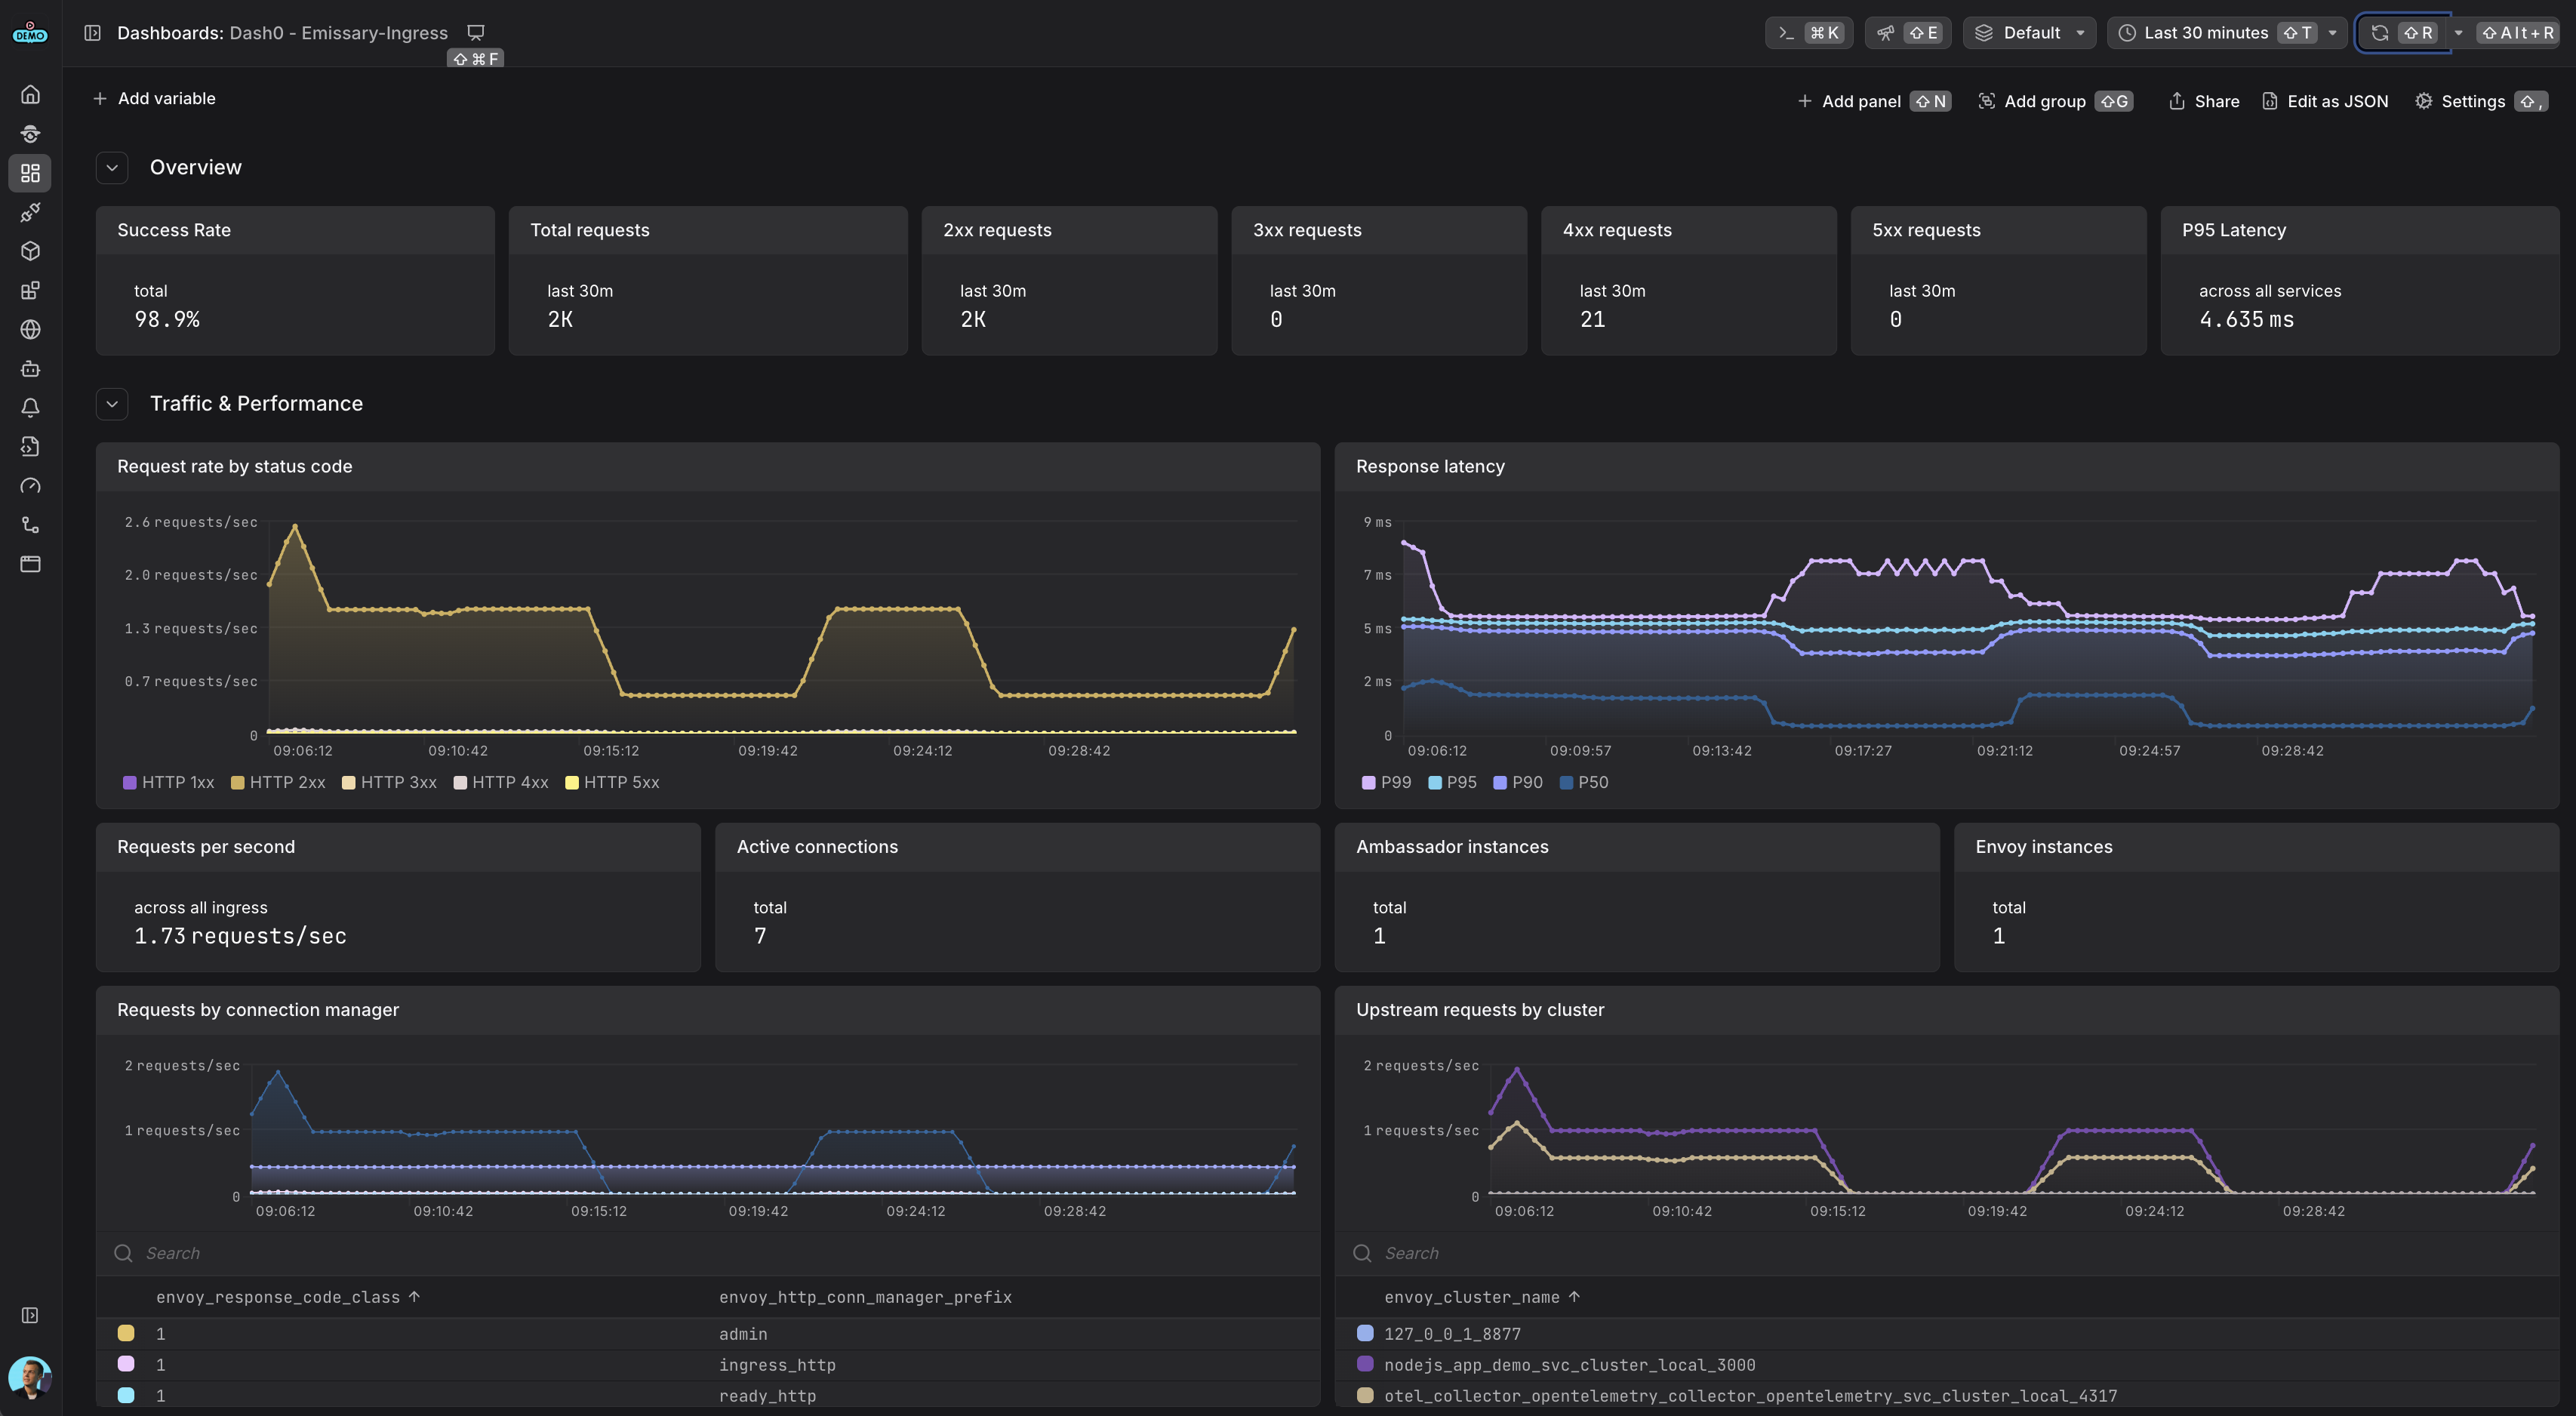
Monitor Emissary ingress service request rates, latency percentiles, HTTP status codes, active connections, and Envoy resource usage
Emissary-ingress is an open-source Kubernetes-native API Gateway and ingress controller built on Envoy Proxy. It provides advanced traffic management, observability, and security features for cloud-native applications.
The Dash0 integration provides complete observability for Emissary-ingress deployments using OpenTelemetry-native instrumentation for metrics and distributed tracing, plus structured access logs.
For more information, visit the Emissary-ingress Documentation.
Gain comprehensive visibility into your Emissary-ingress setup and optimize performance with the following observability features:
Use this integration to streamline monitoring of your API gateway traffic, debug routing issues, and ensure your platform services are operating efficiently.
Emissary ingress includes built-in support for observability via Prometheus metrics, OpenTelemetry tracing, and structured access logs through its underlying Envoy Proxy. This integration uses the recommended pattern of deploying an OpenTelemetry Collector in your cluster to collect telemetry from Emissary ingress and forward it to Dash0.
For more details, refer to the Emissary ingress Observability Documentation.
You'll need an OpenTelemetry Collector deployed in your cluster to collect telemetry from Emissary ingress and forward it to Dash0.
For production environments, consider using one of these deployment methods:
Helm Chart for The OpenTelemetry Collector
For a complete working example with collector configuration, see the Dash0 Emissary ingress Example.
Create a dedicated TracingService resource to configure OpenTelemetry tracing:
Configure the Ambassador module with structured logging and reference the tracing service:
Important: The traceparent field in the log format above enables trace correlation. Your OpenTelemetry Collector must be configured to extract the trace_id and span_id from this field for proper log-trace correlation. Configure a transform processor like this:
Install or upgrade Emissary ingress with optimized configuration for observability. You can use a values.yaml file:
Then deploy with:
After deployment, verify that telemetry is being collected:
The integration will provide visibility into request routing, performance metrics, distributed traces, and correlated access logs across your API gateway infrastructure.
Refer to the complete example for detailed configuration options.