Dash0 Raises $110M Series B at $1B Valuation
Monitor Contour ingress controller performance, request routing, and traffic patterns with OpenTelemetry metrics and distributed tracing.
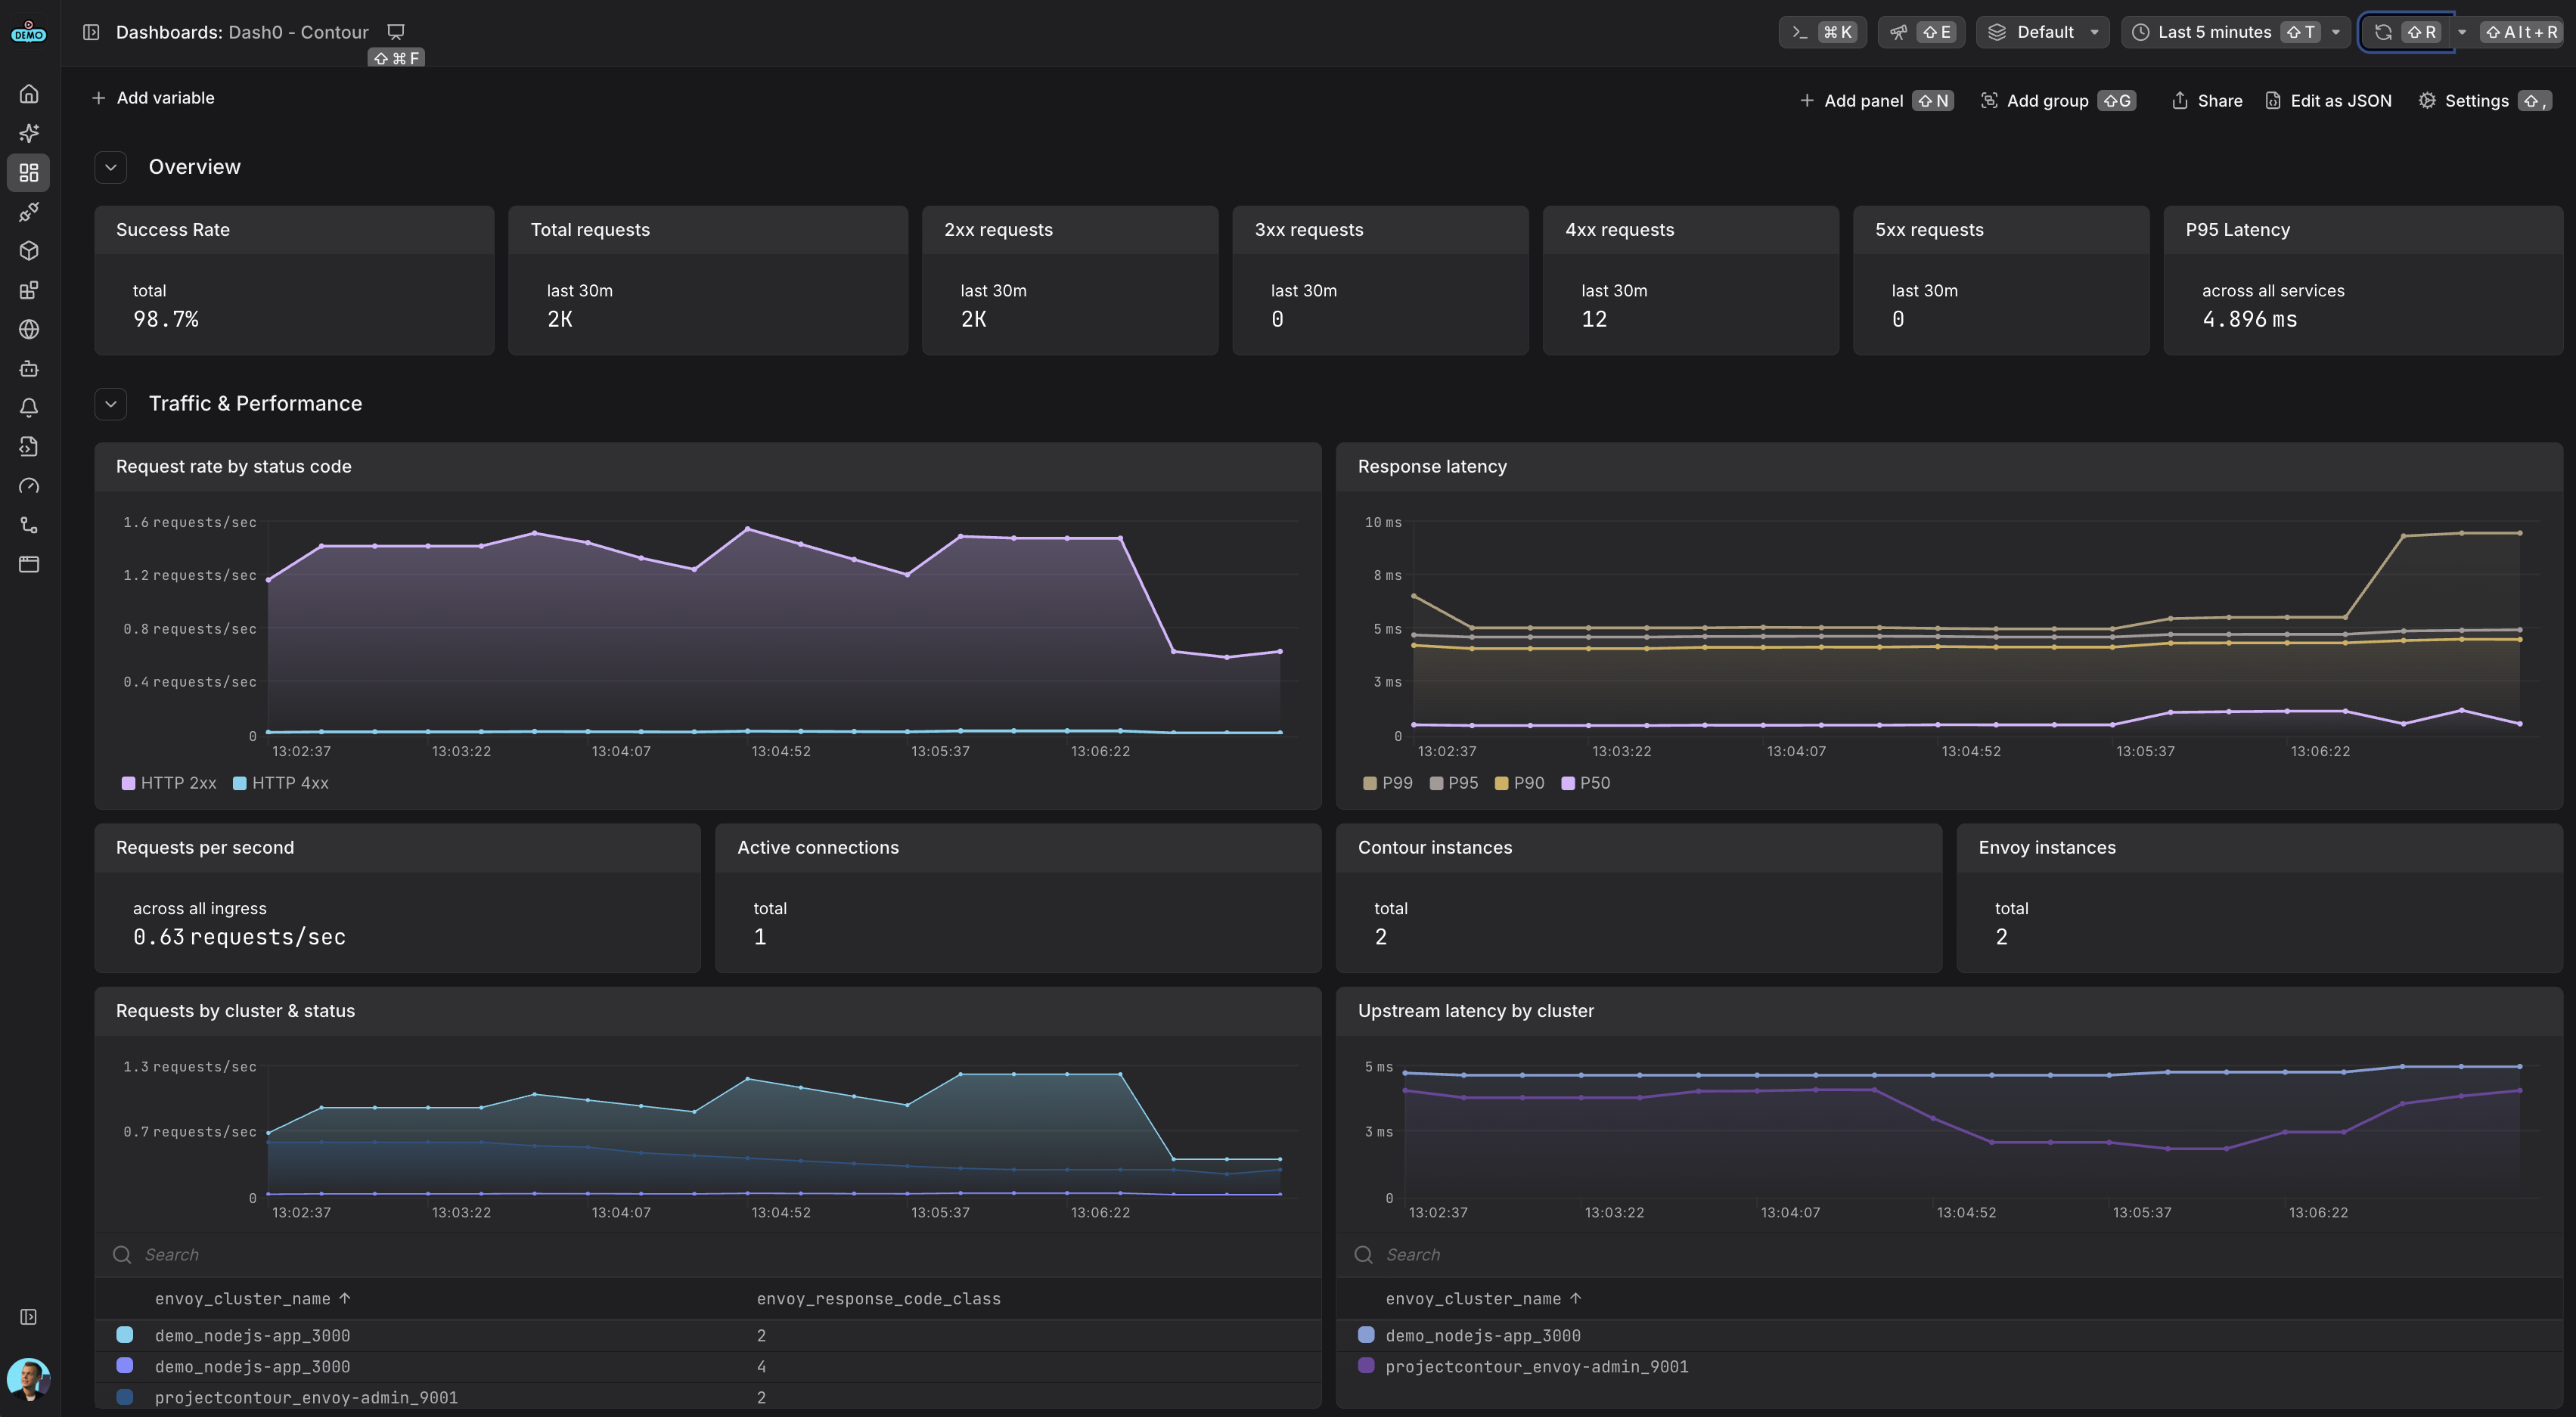
Monitor Contour service request rates, latency percentiles, HTTP status codes, active connections, and Envoy resource usage
Contour is a modern, high-performance ingress controller for Kubernetes that uses Envoy Proxy as its data plane. Contour offers advanced traffic management capabilities including load balancing, TLS termination, and request routing.
This integration provides complete observability for Contour deployments using OpenTelemetry-native instrumentation for distributed tracing, plus Prometheus metrics and structured JSON access logs collected via the OpenTelemetry Collector.
For more information, visit the Contour Documentation.
Gain comprehensive visibility into your Contour setup and optimize performance with the following observability features:
Use this integration to streamline monitoring of your edge traffic, debug routing issues, and ensure your platform services are operating efficiently.
Contour includes built-in support for observability via OpenTelemetry distributed tracing, Prometheus metrics, and structured access logs. This integration uses the recommended pattern of deploying an OpenTelemetry Collector in your cluster to collect telemetry from Contour and Envoy and forward it to Dash0.
For more details, refer to the Contour Tracing Documentation and Envoy Metrics Documentation.
You'll need an OpenTelemetry Collector deployed in your cluster to collect telemetry from Contour and forward it to Dash0.
For production environments, consider using one of these deployment methods:
Helm Chart for The OpenTelemetry Collector
For a complete working example with collector configuration, see the Dash0 Contour Example.
The OpenTelemetry Collector needs specific configuration to collect all three signals from Contour:
Configure the Collector to scrape metrics from both Contour and Envoy using the prometheus receiver:
Configure the Collector to collect Envoy access logs from container logs using the filelog receiver:
Use OpenTelemetry Transformation Language (OTTL) to extract trace and span IDs from the traceparent header in access logs:
Note: Envoy doesn't expose trace_id and span_id tokens directly. The OTTL transformation extracts these from the traceparent header and sets trace_id.string and span_id.string, which Dash0 accepts for correlation.
For a complete collector configuration example, see the Dash0 Contour Example which includes:
Create an ExtensionService that points to your configured OpenTelemetry Collector:
Create a ContourConfiguration to enable distributed tracing and structured access logs:
Install Contour using the Bitnami Helm chart (since the official chart isn't published yet):
For more details, refer to the Contour Tracing, Envoy Metrics, and Contour Prometheus Metrics documentation.
For a complete working example with Contour, OpenTelemetry Collector, and demo applications, see the Dash0 Contour Example.