The quickest way to get logs from a Docker container is docker logs <container>. That gets you everything the container has written to stdout and stderr since it started. For most debugging sessions, you'll want a few flags on top of that, and there are a few things about how Docker stores and retains logs that will bite you if you don't know about them.
This guide covers the full docker logs toolkit: filtering by time, streaming live output, finding log files on disk, understanding logging drivers, and avoiding the pitfalls that catch people off guard.
The basic command
To view logs from a running or stopped container, pass the container name or ID:
1docker logs my-container
This dumps the full log history. If the container has been running for a while and generating output, that's a lot of text. Use --tail to limit output to the last N lines:
1docker logs --tail 100 my-container
The output lands on your terminal and exits. No streaming, no persistence, just a snapshot of what Docker has buffered. Here's what that looks like:
1232026-05-11T08:42:01.123Z INFO Server started on port 30002026-05-11T08:42:05.456Z INFO Connected to database2026-05-11T08:43:12.789Z ERROR Failed to process request: timeout
Following logs in real time
To stream logs as they're generated, add --follow (or -f):
1docker logs --follow my-container
This prints the full history first, then starts streaming. If you're troubleshooting a live issue, you usually don't want the full history. Combine --follow with --tail to get a small window of recent context and then stream from there:
1docker logs --follow --tail 50 my-container
Press Ctrl+C to stop streaming. The container keeps running, you're just detaching from the log stream.
Filtering by time
Use --since to show only logs generated after a given point in time. This accepts a Go duration string, a Unix timestamp, or an RFC 3339 timestamp:
12docker logs --since 30m my-containerdocker logs --since 2026-05-11T09:00:00Z my-container
To bound a time window from both ends, combine --since with --until:
1docker logs --since 2026-05-11T09:00:00Z --until 2026-05-11T09:15:00Z my-container
Note: Always include a timezone suffix (Z for UTC, or +HH:MM offset) in your timestamps. Without one, Docker interprets the timestamp using the host's local timezone, which can produce unexpected results on servers not configured in UTC.
You can pair --since with --follow to start streaming from a point in the past. You can't combine --until with --follow. That's a documented Docker limitation, not an oversight on your part.
Adding timestamps
Docker stores its own timestamp for every log line, but doesn't show it by default. Pass -t or --timestamps to include them:
1docker logs --timestamps --tail 50 my-container
Here's what that looks like. Docker prepends an RFC 3339 timestamp to each line:
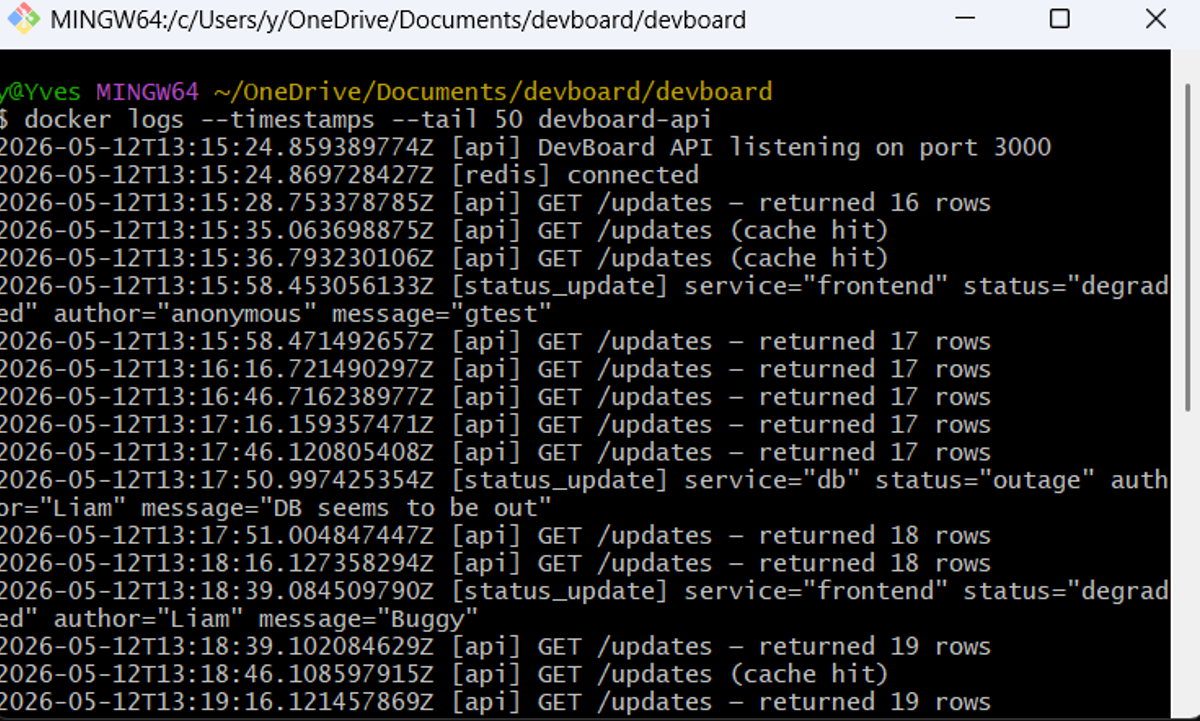
This is useful when the application itself doesn't include timestamps in its output.
Searching and filtering output
docker logs has no built-in grep. Pipe to standard Unix tools instead:
123docker logs my-container | grep -i errordocker logs my-container | grep -E "(ERROR|WARN)"docker logs my-container | grep -C 5 "connection refused"
One gotcha: Docker writes stderr and stdout as separate streams. Some errors go to stderr, and grep on a bare pipe may miss them. Redirect stderr to stdout first:
1docker logs my-container 2>&1 | grep -i error
Where log files live on disk
When you're using the default json-file logging driver, Docker stores each container's logs at:
1/var/lib/docker/containers/<container-id>/<container-id>-json.log
You can find the exact path for a specific container without navigating that directory manually. Run docker inspect with a Go template to pull the LogPath field directly:
1docker inspect --format='{{.LogPath}}' my-container
1/var/lib/docker/containers/a1b2c3d4e5f6.../a1b2c3d4e5f6...-json.log
The file is plain JSON, one object per line, so it's readable with cat, tail, or any log shipper that understands JSON. You can read it directly if you need to, which is useful when a container has already exited and the daemon isn't running.
Logging drivers
The logging driver determines where and how Docker stores log output. By default it's json-file, which writes to the path described above. Check what driver a running container is using:
1docker inspect -f '{{.HostConfig.LogConfig.Type}}' my-container
1json-file
The three drivers you'll encounter most often:
json-file stores logs as newline-delimited JSON on the local filesystem. The docker logs command works with it out of the box. The significant downside is that it doesn't rotate logs by default. Containers that generate a lot of output will fill your disk. To fix this, configure max-size and max-file in /etc/docker/daemon.json. Docker now recommends the local driver over json-file for most production workloads; it rotates logs automatically, uses a more compact format, and docker logs still works with it.
journald routes log output into systemd's journal. If your host runs systemd (most modern Linux distros do), this integrates neatly with journalctl, giving you all your container logs alongside system logs in a single queryable store with automatic rotation.
syslog forwards logs to a local or remote syslog daemon. Good fit if you're already routing system logs through rsyslog or syslog-ng to a central location.
One important constraint: docker logs only works with json-file, local, and journald. If you switch to fluentd, awslogs, or another external driver, the docker logs command returns nothing. The logs are going somewhere else entirely.
Why logs disappear when a container is removed
This one catches people constantly, and it's worth being direct about: Docker logs are tied to the container's lifecycle. When you run docker rm, the log files on disk are deleted along with the rest of the container's filesystem layer. If you remove a crashed container before extracting its logs, they're gone.
Save logs to a file before removing:
1docker logs my-container > container-logs.txt 2>&1
The right fix for long-term retention is to use a logging driver that ships logs to an external system before the container is removed, or to mount a volume and write application logs there in addition to stdout.
Common pitfalls
docker logs returns nothing
Check the logging driver. If it's set to fluentd, awslogs, or anything other than json-file, local, or journald, the output is going somewhere else. Run docker inspect -f '{{.HostConfig.LogConfig.Type}}' my-container to verify.
Logs stop showing up mid-stream
Some applications buffer stdout when they detect no interactive terminal. In Python, set PYTHONUNBUFFERED=1. In Node.js, write to process.stdout rather than through a library that buffers. Check your application's buffering behavior before assuming Docker is the problem.
Log files consuming all available disk space
You hit the no-rotation default on json-file. Add max-size and max-file to your daemon config, or switch to the local driver. Existing containers aren't affected by daemon config changes. You'll need to recreate them to pick up the new settings.
Final thoughts
docker logs with --follow and --tail covers most debugging workflows. Time filtering with --since and --until is underused and worth knowing. The logging driver question matters more than most people realize. Get it wrong and docker logs silently returns nothing.
Per-container log access works fine on a single host. Once you're running dozens of containers across multiple hosts, you want logs centralized somewhere you can search across services and correlate with traces and metrics. That's where an OpenTelemetry Protocol (OTLP)-native pipeline pays off: collect once, route everywhere, and keep logs in the same data store as your distributed traces and infrastructure metrics.
If you're using Docker Compose, the Docker Compose Logs guide covers the same concepts with multi-container specifics. For a deeper look at centralizing Docker logs with OpenTelemetry, see Mastering Docker Logs. Once you have logging sorted, the natural next step is proactive monitoring: tracking CPU, memory, and container lifecycle events before they become incidents. How to Monitor Docker Containers covers that side of the picture.
Dash0 ships an OpenTelemetry Collector configuration that collects Docker container logs, enriches them with resource attributes, and routes them over OTLP to Dash0's backend, where they sit alongside distributed traces and infrastructure metrics in a single queryable view. No proprietary agents, no lock-in.
 Start a free trial to correlate your container logs with traces and metrics in one place. No credit card required.