Monitoring Docker containers means tracking three things: resource usage (CPU, memory, network, disk I/O), container health and lifecycle events (restarts, OOM kills, exits), and application-level signals from the processes running inside them. Docker gives you built-in tools for the first two. For the third, you need instrumentation at the application layer.
This article walks through the monitoring options from quickest to most complete, so you can pick the right level for where you are.
Start with docker stats
The fastest way to see what's happening across your running containers is docker stats. It reads directly from the Linux kernel's cgroup filesystem and streams live updates to your terminal.
Run it with no arguments to monitor everything:
1docker stats
Now you should see your stats displayed.
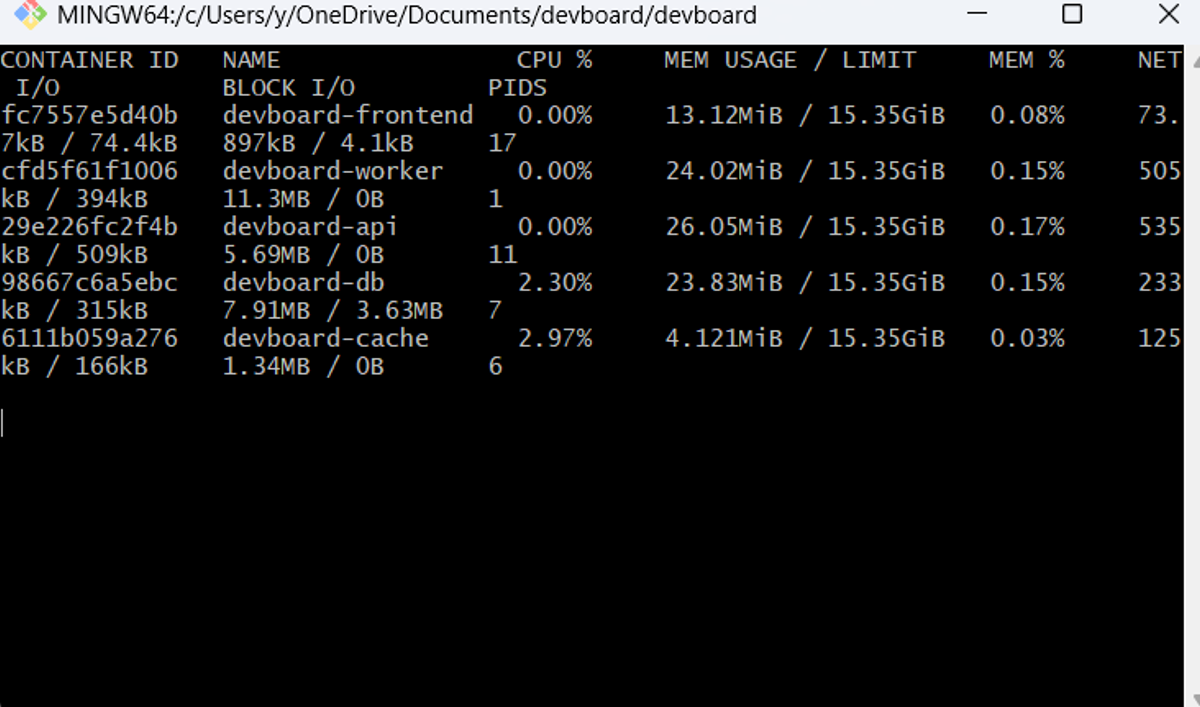 A few things worth knowing about this output that most articles skip over:
MEM USAGE is not the raw allocated bytes
On Linux, Docker subtracts the page cache (reclaimable filesystem buffers) from the raw figure before displaying it. What you're seeing is closer to the container's Resident Set Size (RSS): anonymous memory pages that can't be reclaimed without killing the process. This is the number that actually matters for tracking memory leaks.
CPU % is relative to one core, not the host total
On a 16-core host, a container can report 1600% CPU if it's maxing out all cores. If you've set a CPU limit (e.g. --cpus=2), the percentage is still relative to one core, not the capped limit. Keep that in mind when setting alert thresholds.
MEM LIMIT shows 0B if you haven't set one
That means the container can consume all available host memory. A runaway process will take down the host, not just the container.
For scripting and one-off snapshots, use --no-stream:
1docker stats --no-stream --format "table {{.Name}}\t{{.CPUPerc}}\t{{.MemUsage}}\t{{.MemPerc}}"
1234NAME CPU % MEM USAGE / LIMIT MEM %web 2.34% 45.2MiB / 512MiB 8.83%api 15.67% 234MiB / 1GiB 22.85%postgres 5.12% 156MiB / 2GiB 7.62%
The --no-stream flag makes docker stats exit immediately after printing one sample, which is what you want for cron jobs or CI pipelines. For a deeper look at what docker stats exposes and how to script around it, see our guide to monitoring container resource usage with Docker Stats.
Watch container lifecycle events
docker stats only covers running containers. To catch restarts, OOM kills, and unexpected exits, you need docker events.
1docker events --filter 'event=die' --filter 'event=oom'
122026-05-11T09:43:12.441Z container die a1b2c3 (exitCode=137, name=api, image=myapp:1.4.2)2026-05-11T09:43:13.002Z container oom a1b2c3 (name=api, image=myapp:1.4.2)
Exit code 137 means the container was killed by signal 9 (SIGKILL). Combined with the oom event, this confirms the OOM killer terminated the process. If you see frequent 137 exits without an accompanying oom event, something else is killing the container, likely a health check failure, an orchestrator timeout, or a manual docker kill.
You can format the output with Go templates to make it easier to parse or pipe into a log aggregator:
1docker events --format '{{.Time}} {{.Actor.Attributes.name}} {{.Action}} exitCode={{.Actor.Attributes.exitCode}}'
122026-05-11T09:43:12.441Z api die exitCode=1372026-05-11T09:43:13.002Z api oom exitCode=
Add persistent metrics with cAdvisor
docker stats and docker events are terminal tools: no history, no alerting, no aggregation. For production, you need metrics that persist and can be queried over time.
cAdvisor (Container Advisor) is the standard exporter for this. It reads the same cgroup data as docker stats but exposes it as Prometheus metrics, giving you per-container CPU, memory, network, and block I/O with configurable scrape intervals. For a complete walkthrough of setting up and querying cAdvisor, see our Docker Monitoring with cAdvisor: The Definitive Guide.
The quickest way to run it:
12345678docker run -d \--name cadvisor \--volume=/:/rootfs:ro \--volume=/var/run:/var/run:ro \--volume=/sys:/sys:ro \--volume=/var/lib/docker/:/var/lib/docker:ro \--publish=8080:8080 \gcr.io/cadvisor/cadvisor:latest
cAdvisor's web UI is now available at http://localhost:8080. More usefully, Prometheus metrics are available at http://localhost:8080/metrics. Some key ones to alert on:
| Metric | What to watch for |
|---|---|
container_cpu_usage_seconds_total | Rate above baseline; compare against limit |
container_memory_working_set_bytes | Steady upward trend suggests a leak |
container_oom_events_total | Any nonzero value needs investigation |
container_last_seen | Gaps indicate containers that stopped unexpectedly |
Note that container_memory_working_set_bytes is the right metric to watch for OOM risk, not container_memory_usage_bytes. Working set memory can't be reclaimed under pressure; usage includes the page cache and will appear higher than it really is. This distinction trips up nearly everyone the first time they set up container alerting.
Use the OTel Collector for multi-signal monitoring
If you want container metrics alongside application traces and logs in the same platform, the OpenTelemetry Collector's Docker Stats receiver is worth setting up. It queries the Docker daemon directly, collects the same resource metrics, and routes them over OTLP to whatever backend you're using. For a broader introduction to the Collector's pipeline model, see our OpenTelemetry Collector beginner's guide.
Here's a minimal otel-collector-config.yaml that collects Docker container metrics every 10 seconds:
1234567891011121314151617receivers:docker_stats:endpoint: unix:///var/run/docker.sockcollection_interval: 10scontainer_labels_to_metric_labels:com.docker.compose.service: compose.servicecom.docker.compose.project: compose.projectexporters:otlp:endpoint: your-backend:4317service:pipelines:metrics:receivers: [docker_stats]exporters: [otlp]
Run the Collector as a container alongside your workloads:
12345docker run -d \--name otel-collector \--volume /var/run/docker.sock:/var/run/docker.sock:ro \--volume $(pwd)/otel-collector-config.yaml:/etc/otelcol-contrib/config.yaml \otel/opentelemetry-collector-contrib:latest
One thing the OTel Collector docs don't emphasize: recent versions of the official collector images run as a non-root user. Check the release notes for the version you're deploying. If the Docker socket isn't accessible to the container's user, the receiver will fail silently. To fix it, get your host's Docker group ID and pass it as a supplementary group:
1getent group docker # note the GID, e.g. 999
If you already started the collector without the group flag, remove it first:
1docker rm -f otel-collector
Then start it again with the supplementary group:
123456docker run -d \--name otel-collector \--group-add 999 \--volume /var/run/docker.sock:/var/run/docker.sock:ro \--volume $(pwd)/otel-collector-config.yaml:/etc/otelcol-contrib/config.yaml \otel/opentelemetry-collector-contrib:latest
Common pitfalls
Setting no memory limits
Without --memory, a container can consume all host memory and trigger the kernel's OOM killer on other processes, including the Docker daemon itself. Set limits in production. The right value is your application's peak observed usage plus a 20-30% buffer.
Confusing container_memory_usage_bytes with actual consumption
This metric includes the page cache, which the kernel can reclaim freely. A container at 80% "memory usage" may actually be under no pressure at all if most of that is cached files. Use container_memory_working_set_bytes for alerting instead.
Misreading exit code 137
Exit code 137 means SIGKILL, but that signal can come from docker stop timing out, an orchestrator evicting the container, or a health check failure, not just the OOM killer. Correlate with docker events to confirm whether an oom event preceded the exit. Assuming OOM without checking is the most common misdiagnosis in container debugging.
Not monitoring the Docker host
Containers share the host's kernel and hardware. A container that consumes all disk I/O budget will slow down every other container on the same host. Container-level metrics alone don't tell you whether you're approaching host-level capacity limits. Add host-level metrics (available via Node Exporter) alongside container metrics.
Final thoughts
For local development and quick production triage, docker stats and docker events cover the basics with zero setup. Skip them for production monitoring — they're debugging tools, not a monitoring strategy. For production, you want persistent metrics with historical data and alerting: cAdvisor plus Prometheus gets you there for free and open source, and the OTel Collector's Docker Stats receiver gives you the same data with a path to correlating container metrics against application traces and logs.
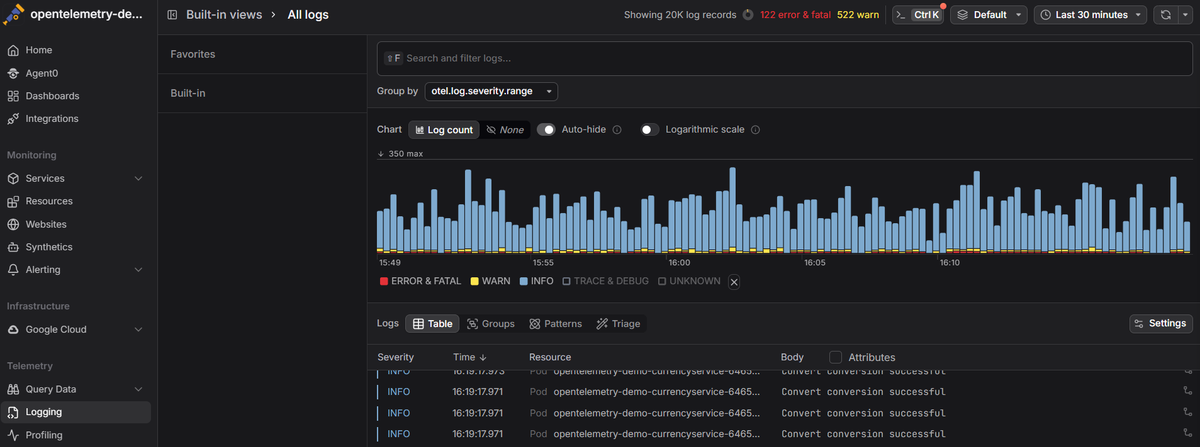
The correlation is where it pays off. When memory climbs on a specific container, you want to pivot to that service's recent traces to see which requests are allocating the most, or check the logs for warnings that preceded the climb. That kind of cross-signal investigation is hard to stitch together from separate CLI tools.
Dash0 is built on OTLP and PromQL natively, so container metrics, logs, and distributed traces live in the same data model. There's no translation layer between signal types, which means your infrastructure monitoring, log management, and distributed tracing queries all use the same language. Your team learns PromQL once and applies it everywhere.
 Start a free trial to see your container metrics, logs, and traces in a single view. No credit card required.