
Continuous profiling with zero compromise
Production-ready profiling with less than 1% overhead. No debug symbols in production binaries, just upload them via CI/CD

Polar Signals is trusted by


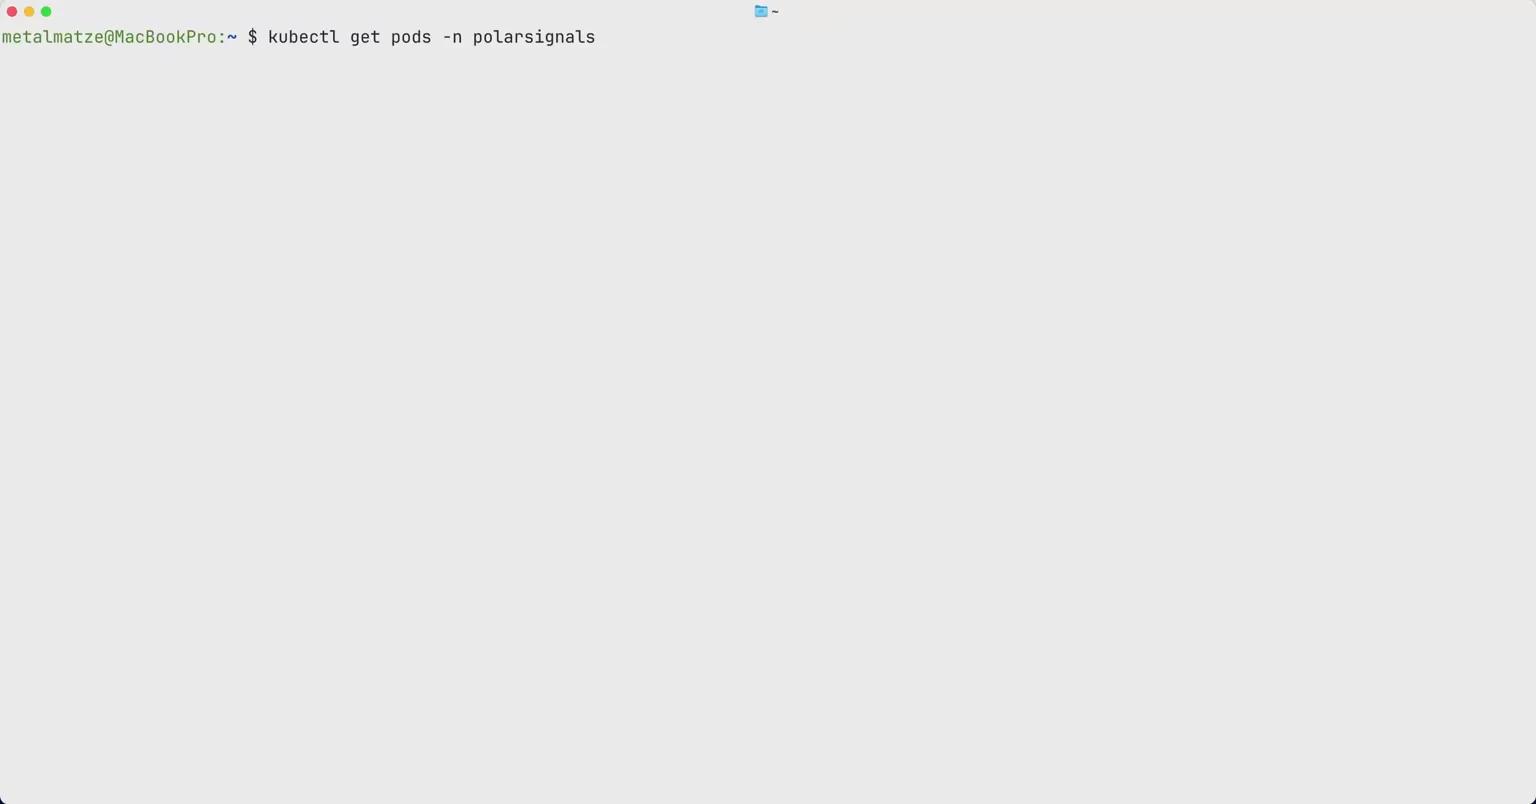
One-command Kubernetes deployment
Deploy the agent to your Kubernetes cluster with a single kubectl command. No complex configuration required - just paste the URL and you’re profiling. Note: Kubernetes is not required - any Linux 5.4+ environment is sufficient
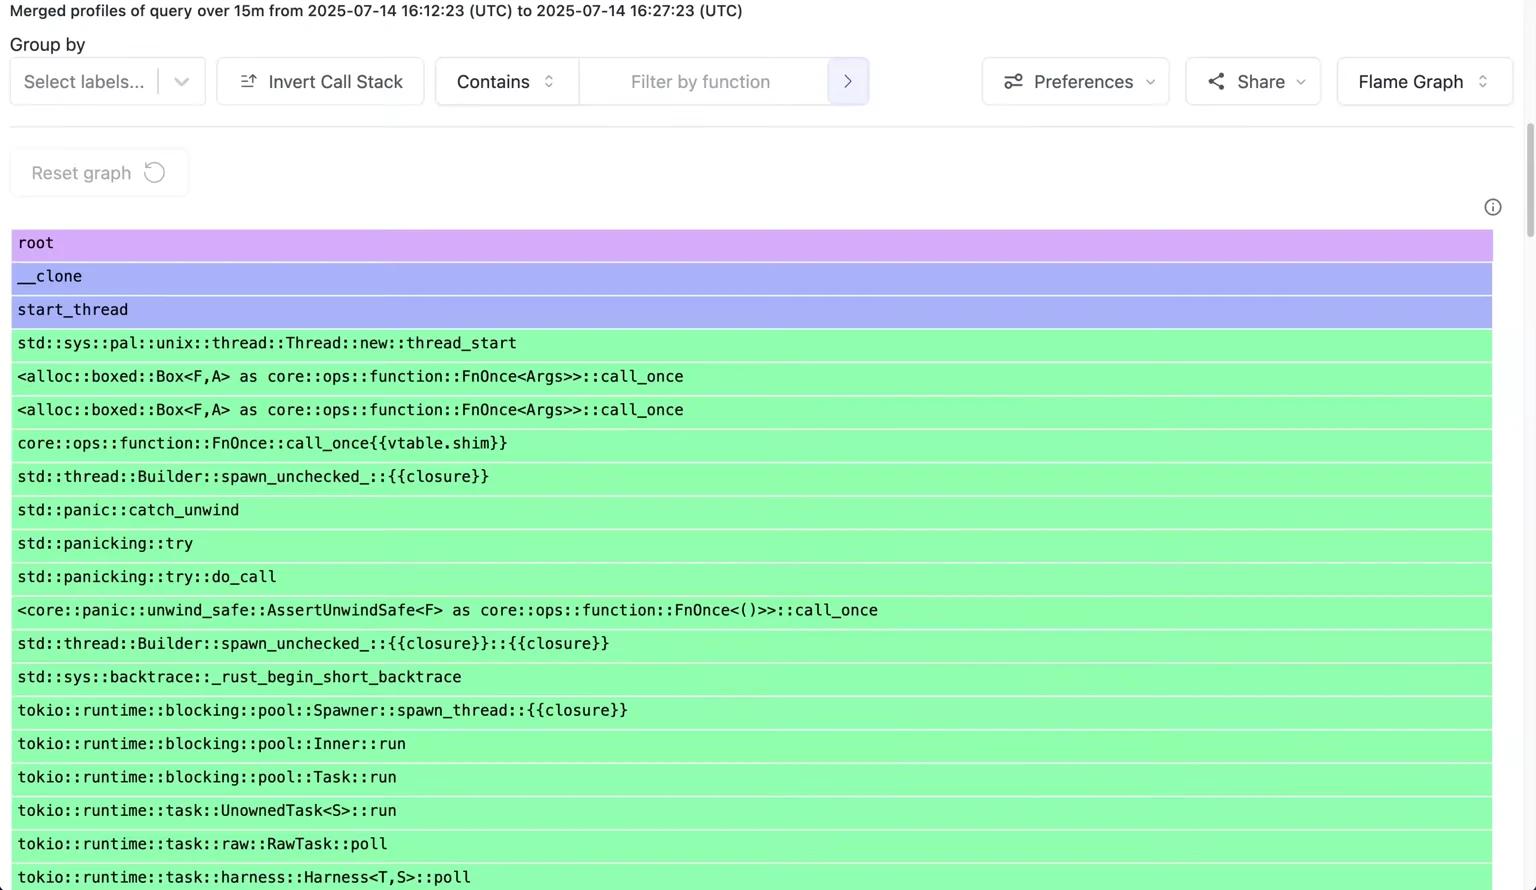
See where your CPU time goes
View profiling data as Flamegraphs to clearly understand where your application spends most of its CPU time and which parts of the code are consuming the most resources
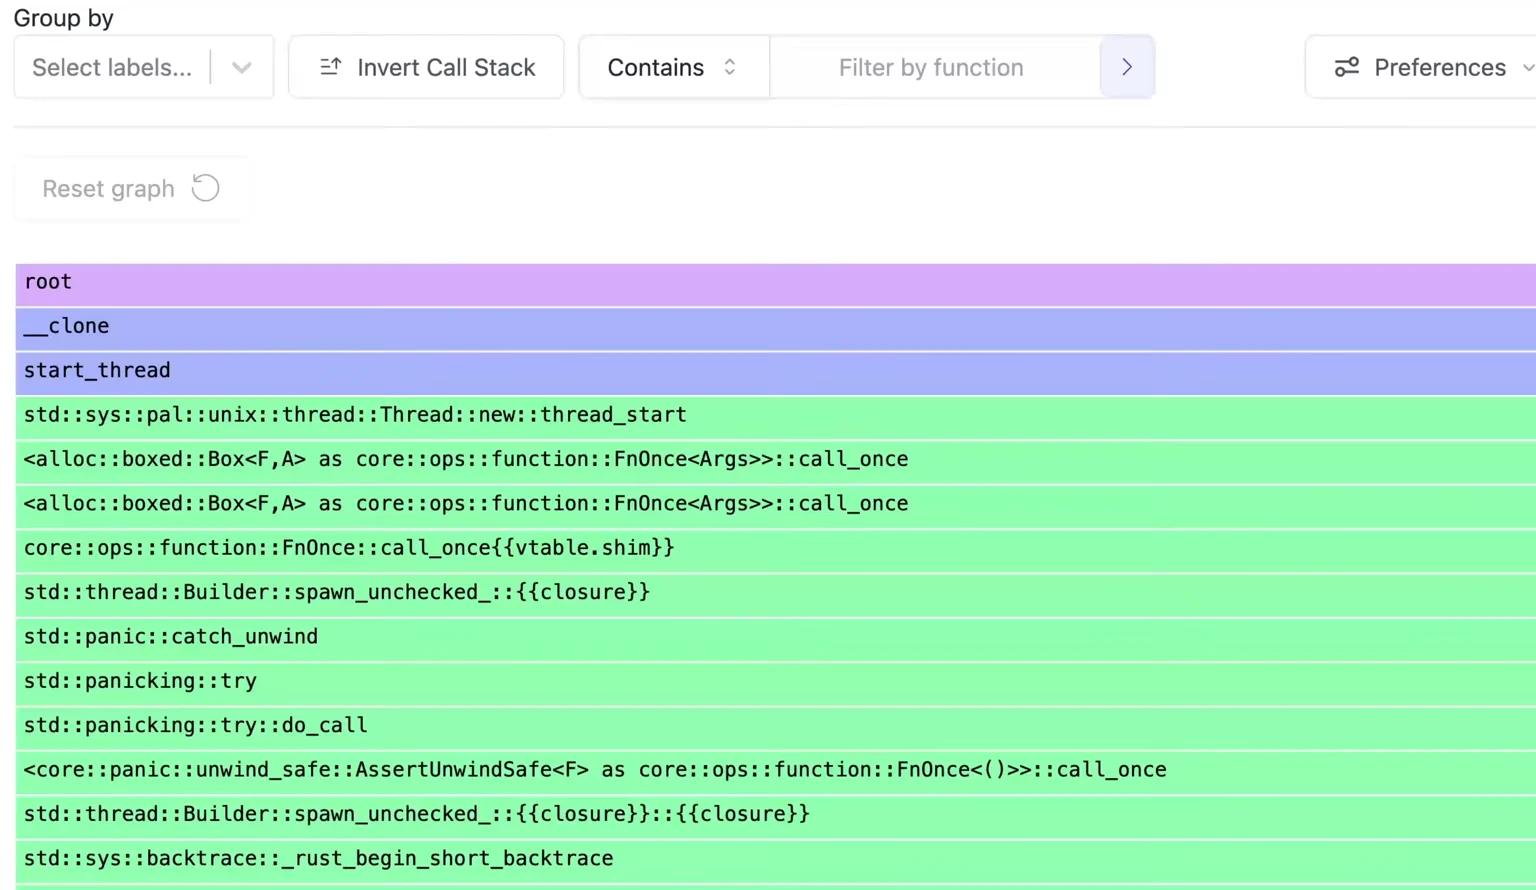
Find the one thread holding up the rest
Understand when a single thread is dominating your workload and limiting overall performance. Group flamegraphs by thread or any custom label to uncover bottlenecks and identify opportunities for better parallelization
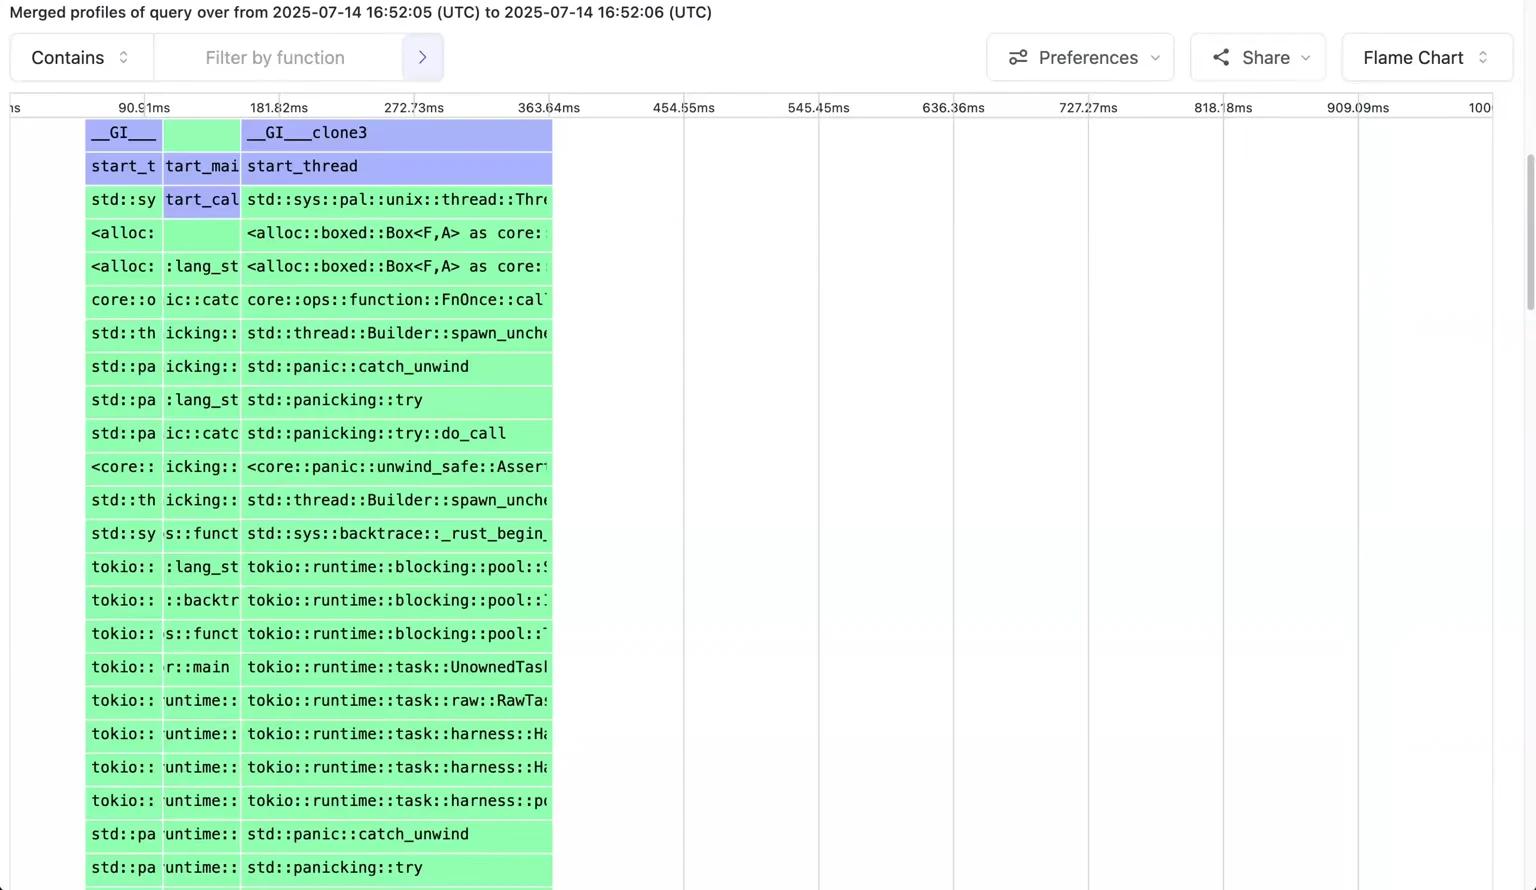
See exactly when things slow down
Track exactly when performance issues occur with Flamecharts, showing the chronological flow of your application’s execution, revealing execution patterns and timing-related performance issues.
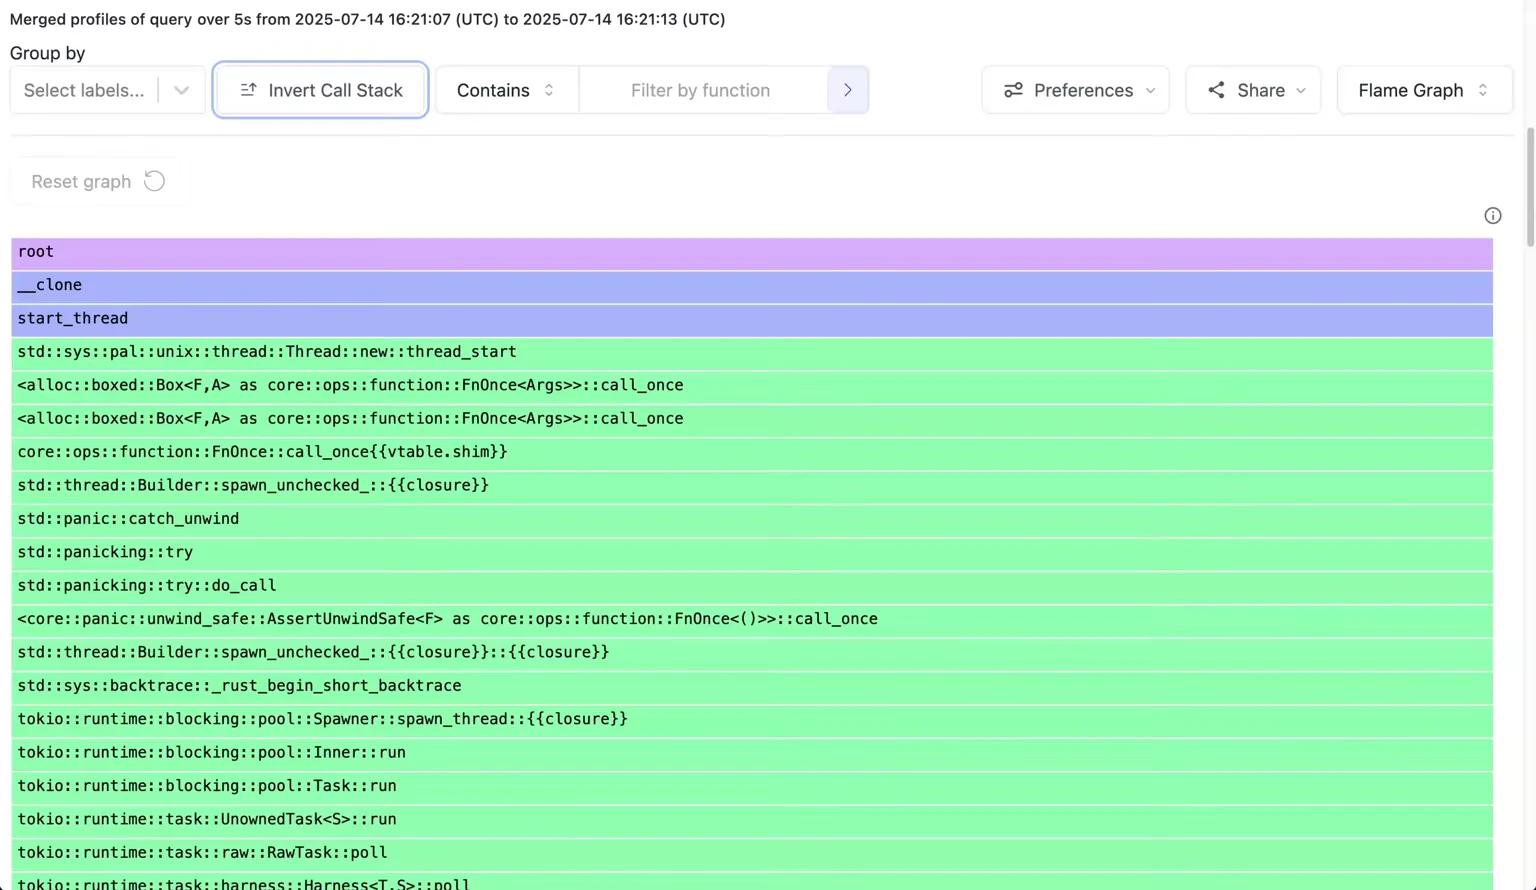
Spot your hottest functions instantly
Easily spot functions with hot code paths by using Stack Inverting, making it easier to see where optimization work will have the biggest impact
Frequently asked questions
With Continuous Profiling you can understand CPU and memory usage in production via multiple metrics, correlate CPU activity with the traces and spans running alongside it, and visualize CPU time spent as flame graphs to find out exactly what your code is busy doing.
No, you don’t have to use Kubernetes or even containers. The profiler just needs Linux 5.4+ with eBPF support.
Right now, the profiler collects CPU time by function (visualized as flame graphs) and memory allocations, with more metrics planned over time.
Continuous Profiling supports native languages like Go, Rust, and C/C++, plus interpreted and JIT-complied runtimes including Java, Python, Node.js, Ruby, PHP, and .NET.
Ship faster, waste less, spend smarter
Every unexplained CPU spike and memory leak is time and money. See exactly where performance drops, trace it to the exact function, and fix it before it costs you.