

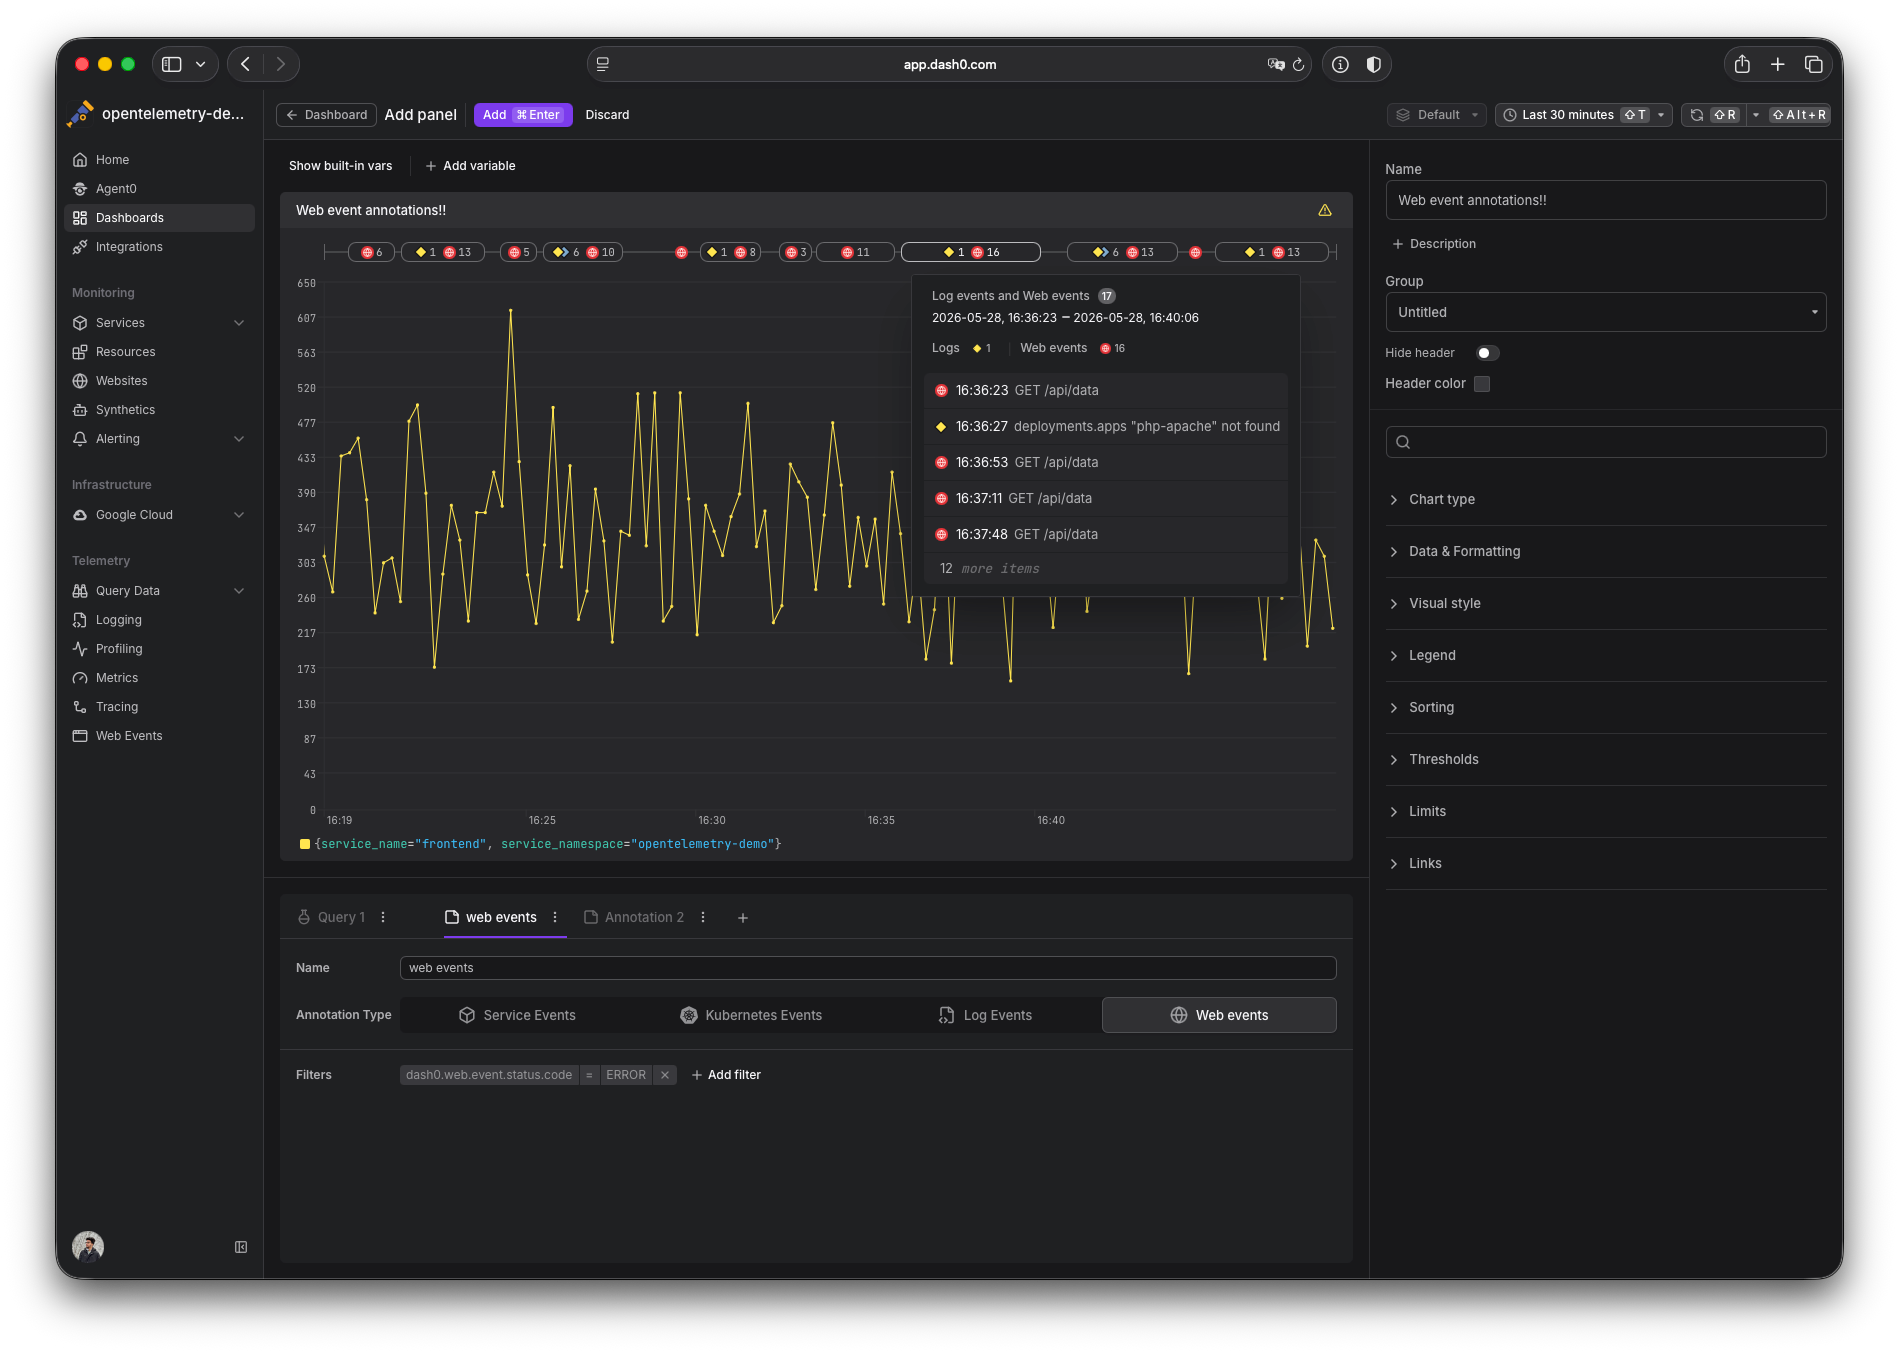
Time-series widgets on dashboards already support annotations from logs, Kubernetes events, and service events. Today, web events join the party.
Add a Web Events annotation to any time-series widget, filter it the way you would in the Web Events Explorer, and the matching events appear as markers on the chart's timeline. When markers cluster, they collapse into a single pill grouped per kind, so a burst of page loads stays visually distinct from, say, a deployment marker sitting right next to it. The chart legend now has its own "Web events" row too, counting them separately from logs.
Each marker comes with a tooltip showing the event's attributes and a one-click link straight to the Web Events Explorer — with the same filter applied and the event already selected — so you can go from "what happened around 14:32?" to the exact session event without losing your place.