Dash0 acquires Polar Signals

Dash0's Terraform provider allows management of your dashboards, alerting, SLOs, telemetry filters, and teams as code, enabling version control and automation of your observability resources.
Terraform is an open-source infrastructure as code (IaC) software tool created by HashiCorp. It allows users to define and provision data center infrastructure using a declarative configuration language known as HashiCorp Configuration Language (HCL), or optionally JSON.
Dash0 offers a Terraform provider that enables you to manage your dashboards, synthetic checks, check rules, recording rules, custom views, notification channels, SLOs, spam filters, time series aggregations, and teams as code, bringing the same benefits of version control, collaboration, and automation to your observability resources that you already enjoy with your infrastructure.
For more information, visit the Terraform Project Page.
The Dash0 Terraform Provider allows you to:
terraform apply shows up as a dashboard annotationThe Dash0 Terraform Provider allows you to manage your dashboards, synthetic checks, check rules, recording rules, views, notification channels, SLOs, spam filters, time series aggregations, and teams as code, bringing infrastructure-as-code practices to your observability resources.
Add the Dash0 provider to your Terraform configuration:
terraform {
  required_providers {
    dash0 = {
      source  = "dash0hq/dash0"
      version = "~> 1.18"
    }
  }
}

provider "dash0" {
  # Default dataset for resources that omit their own `dataset` attribute
  dataset = "{{dataset}}"
}The provider interacts with Dash0 through the public API. You need to specify which API endpoint to use and the auth token to use. The recommended way is via environment variables:
export DASH0_API_URL="{{endpoint_api_http}}"
export DASH0_AUTH_TOKEN="{{token}}"
You can also load credentials from a Dash0 CLI profile
with the profile attribute, or set the url and auth_token attributes on the provider block. Environment variables take
precedence over provider block attributes, which take precedence over the CLI profile.
resource "dash0_dashboard" "my_dashboard" {
  dataset        = "{{dataset}}"
  dashboard_yaml = file("${path.module}/dashboard.yaml")
}
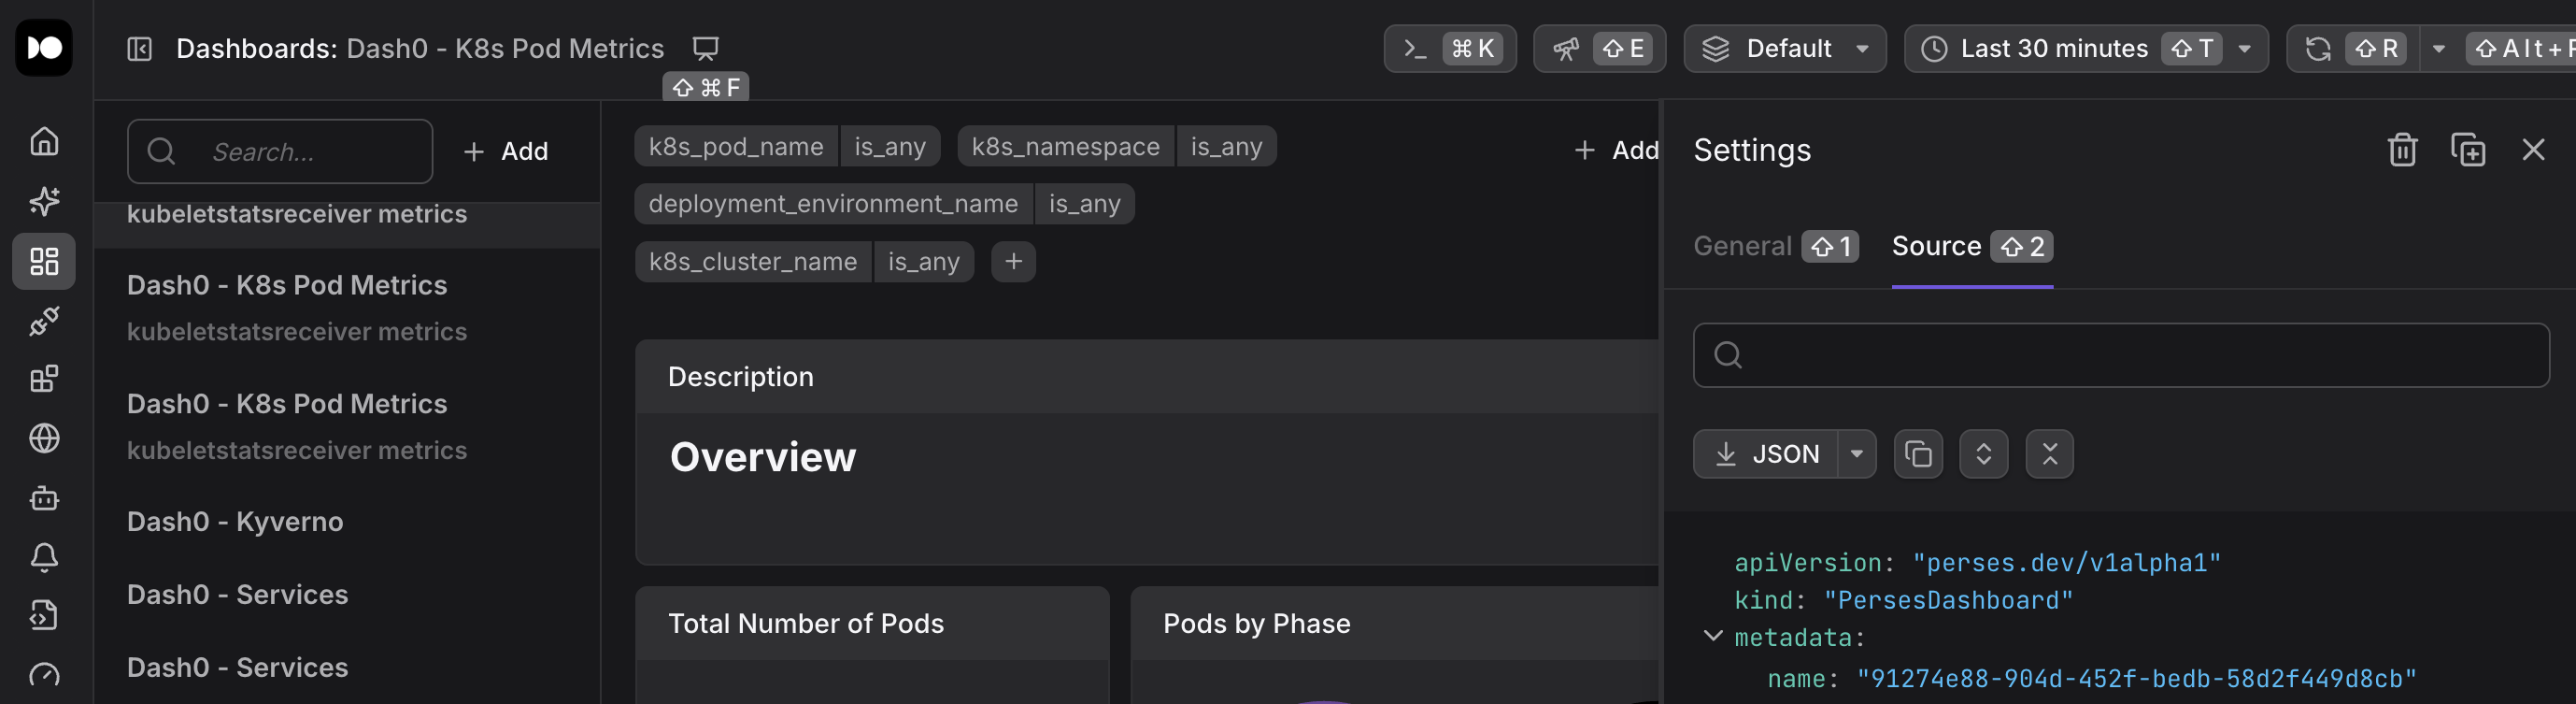
You can download a dashboard's source YAML directly from the Dash0 UI by navigating to Dashboards in the main menu, selecting the desired dashboard, opening Settings > Source, and clicking Download YAML.
Synthetic checks enable you to monitor your services proactively by running automated tests against your endpoints:
resource "dash0_synthetic_check" "my_check" {
  dataset              = "{{dataset}}"
  synthetic_check_yaml = file("${path.module}/synthetic_check.yaml")
}
You can download a synthetic check's source YAML from the Dash0 UI by going to Synthetics in the main menu, selecting the check, and clicking Download YAML. This allows you to version control your synthetic monitoring configurations and deploy them consistently across environments.

Check rules enable you to define alerting rules in Prometheus Rule format for monitoring your services:
resource "dash0_check_rule" "adservice_error_rate" {
  dataset = "{{dataset}}"

  # Currently only one group incl. one rule is supported
  check_rule_yaml = <<-EOF
apiVersion: monitoring.coreos.com/v1
kind: PrometheusRule
metadata:
  name: adservice
spec:
  groups:
    - name: Alerting
      interval: 1m0s
      rules:
        - alert: adservice
          expr: (sum by (service_namespace, service_name) (increase({otel_metric_name = "dash0.spans", service_name = "adservice", service_namespace = "opentelemetry-demo", dash0_operation_name != "", otel_span_status_code = "ERROR"}[5m]))) / (sum by (service_namespace, service_name) (increase({otel_metric_name = "dash0.spans", service_name = "adservice", service_namespace = "opentelemetry-demo", dash0_operation_name != ""}[5m])) > 0)*100 > $__threshold
          for: 0s
          keep_firing_for: 0s
          annotations:
            summary: 'High error percentage for adservice: {{$value|printf "%.2f"}}%'
            description: 'High error percentage for adservice: {{$value|printf "%.2f"}}%'
            dash0-threshold-critical: "40"
            dash0-threshold-degraded: "35"
          labels: {}
EOF
}Recording rules pre-compute frequently needed or expensive PromQL expressions and save the results as new time series.
They use the same Prometheus Rule format as check rules, with record instead of alert:
resource "dash0_recording_rule" "span_duration_p95" {
  dataset = "{{dataset}}"

  recording_rule_yaml = <<-EOF
apiVersion: monitoring.coreos.com/v1
kind: PrometheusRule
metadata:
  name: span-duration-aggregations
spec:
  groups:
    - name: SpanDurationAggregations
      interval: 1m0s
      rules:
        - record: service_name:dash0_spans_duration:p95_5m
          expr: histogram_quantile(0.95, sum by (le, service_name) (rate({otel_metric_name="dash0.spans.duration"}[5m])))
          labels:
            quantile: "0.95"
EOF
}Views allow you to create custom data visualizations and organize your observability data:
resource "dash0_view" "my_view" {
  dataset   = "{{dataset}}"
  view_yaml = file("${path.module}/view.yaml")
}Notification channels define where alerts are delivered, such as Slack, PagerDuty, Opsgenie, email, or webhooks.
They belong to the organization, so they take no dataset:
resource "dash0_notification_channel" "slack" {
  notification_channel_yaml = <<-YAML
kind: Dash0NotificationChannel
metadata:
  name: Slack Alerts
spec:
  type: slack
  config:
    webhookURL: "https://hooks.slack.com/services/T00000000/B00000000/XXXXXXXXXXXXXXXXXXXXXXXX"
    channel: "#alerts"
  frequency: 10m
YAML
}
To route a check rule's alerts to the channel, add its id to the rule's dash0.com/notification-channel-ids
annotation. For a synthetic check, list it under spec.notifications.channels.
Service Level Objectives are defined as OpenSLO v1 documents:
resource "dash0_slo" "checkout_availability" {
  dataset  = "{{dataset}}"
  slo_yaml = file("${path.module}/slo.yaml")
}apiVersion: openslo.com/v1
kind: SLO
metadata:
name: checkout-availability
annotations:
dash0.com/display-name: Checkout availability
dash0.com/enabled: "true"
spec:
description: 99 percent of checkout HTTP requests succeed over a rolling 28-day window.
service: checkout
budgetingMethod: Occurrences
timeWindow:
- duration: 28d
isRolling: true
indicator:
metadata:
name: checkout-success-ratio
spec:
ratioMetric:
counter: true
good:
metricSource:
type: Prometheus
spec:
query: 'http_server_request_duration_seconds_count{service_name="checkout",http_response_status_code!~"5.."}'
total:
metricSource:
type: Prometheus
spec:
query: 'http_server_request_duration_seconds_count{service_name="checkout"}'
objectives:
- displayName: 99% availability
target: 0.99Dash0 supports a subset of OpenSLO: a single objective, an inline ratioMetric indicator, Occurrences budgeting, and
a rolling 28-day window.
Spam filters drop noisy or unwanted telemetry before it is stored:
resource "dash0_spam_filter" "drop_debug_logs" {
  dataset = "{{dataset}}"

  spam_filter_yaml = <<-EOF
apiVersion: v1alpha2
kind: Dash0SpamFilter
metadata:
  name: Drop debug logs
spec:
  context: log
  filter:
    - key: "severity_text"
      operator: "is"
      value: "DEBUG"
EOF
}
context is one of log, span, datapoint, or web_event.
Time series aggregations roll up raw metric data points into pre-aggregated series, reducing cardinality and query cost while keeping the dimensions you care about.
resource "dash0_time_series_aggregation" "http_server_request_duration" {
  dataset = "{{dataset}}"

  time_series_aggregation_yaml = <<-EOF
apiVersion: dash0.com/v1alpha1
kind: Dash0TimeSeriesAggregation
metadata:
  name: http-server-request-duration
spec:
  enabled: true
  display:
    name: HTTP server request duration
  match:
    metricNameMatcher:
      operator: is
      value: http.server.request.duration
  sample:
    interval: 5m
  attributeModifications:
    - kind: drop_attributes
      spec:
        context: datapoint
        keyMatcher:
          operator: is
          value: url.path
EOF
}
Set spec.enabled: true explicitly. Without it, the aggregation is created disabled and produces no rollups.
Teams group organization members so alerts, dashboards, and other assets can be attributed to a shared owner. Like
notification channels, teams belong to the organization and take no dataset:
resource "dash0_team" "backend" {
  team_yaml = <<-YAML
apiVersion: dash0.com/v1alpha1
kind: Dash0Team
metadata:
  name: backend-team
spec:
  display:
    name: Backend Team
    description: Owns backend services and the data platform.
    color:
      from: "#6366F1"
      to: "#8B5CF6"
  members:
    - alice@example.com
    - bob@example.com
YAML
}
Replace the example emails with members of your organization. An email that matches no member fails the apply.
Actions are point-in-time operations you invoke from Terraform. Unlike the resources above, they hold no state and are not reconciled on every plan — a good fit for marking the exact moment terraform apply deploys something, or for sending an arbitrary log event. Actions require Terraform 1.14 or later.
Actions send telemetry via OTLP rather than the API, so they need a second endpoint alongside the authentication you set up in Step 2:
export DASH0_OTLP_URL="{{endpoint_otlp_http}}"dash0_deployment_event sends a dash0.deployment event that Dash0 overlays on dashboards as an annotation, so "what changed right before this graph moved?" has an answer. Attach it to whatever resource represents your deployment with a lifecycle action_trigger block. Any resource works; this example uses a Kubernetes deployment:
resource "kubernetes_deployment" "checkout_api" {
  # ... deployment configuration ...

  lifecycle {
    action_trigger {
      events  = [after_create, after_update]
      actions = [action.dash0_deployment_event.release]
    }
  }
}

action "dash0_deployment_event" "release" {
  config {
    service_name                = "checkout-api"
    service_version             = "1.4.2"
    deployment_environment_name = "production"
    deployment_status           = "succeeded"
    dataset                     = "{{dataset}}"
  }
}dash0_log_event sends an arbitrary log event, mirroring the dash0 logs send CLI command. It does not need to be attached to a resource — invoke it on its own:
action "dash0_log_event" "maintenance_window" {
  config {
    body       = "Starting scheduled maintenance"
    event_name = "acme.maintenance.started"
    dataset    = "{{dataset}}"
  }
}terraform apply -invoke=action.dash0_log_event.maintenance_windowFor the full list of available attributes, see the dash0_deployment_event and dash0_log_event action reference.
For detailed documentation on available resources, configuration options, and usage examples, visit the Dash0 Terraform Provider in the Terraform Registry.