Dash0 Raises $110M Series B at $1B Valuation
Gain full visibility into your Linkerd deployments with this collection of Linkerd dashboards. Monitor performance and health easily.
Linkerd is an open-source service mesh designed for Kubernetes and cloud-native environments.
It provides security, observability, and reliability by seamlessly adding features like zero-config mutual TLS, dynamic request routing, and real-time telemetry.
This Dash0 integration enables users to visualize Linkerd’s telemetry data within their organization, providing insights into service health, traffic patterns, and latency without modifying their existing Linkerd deployment.
For more information, visit the Linkerd website.
Gain real-time visibility into your Linkerd-powered Kubernetes deployments with this integration:
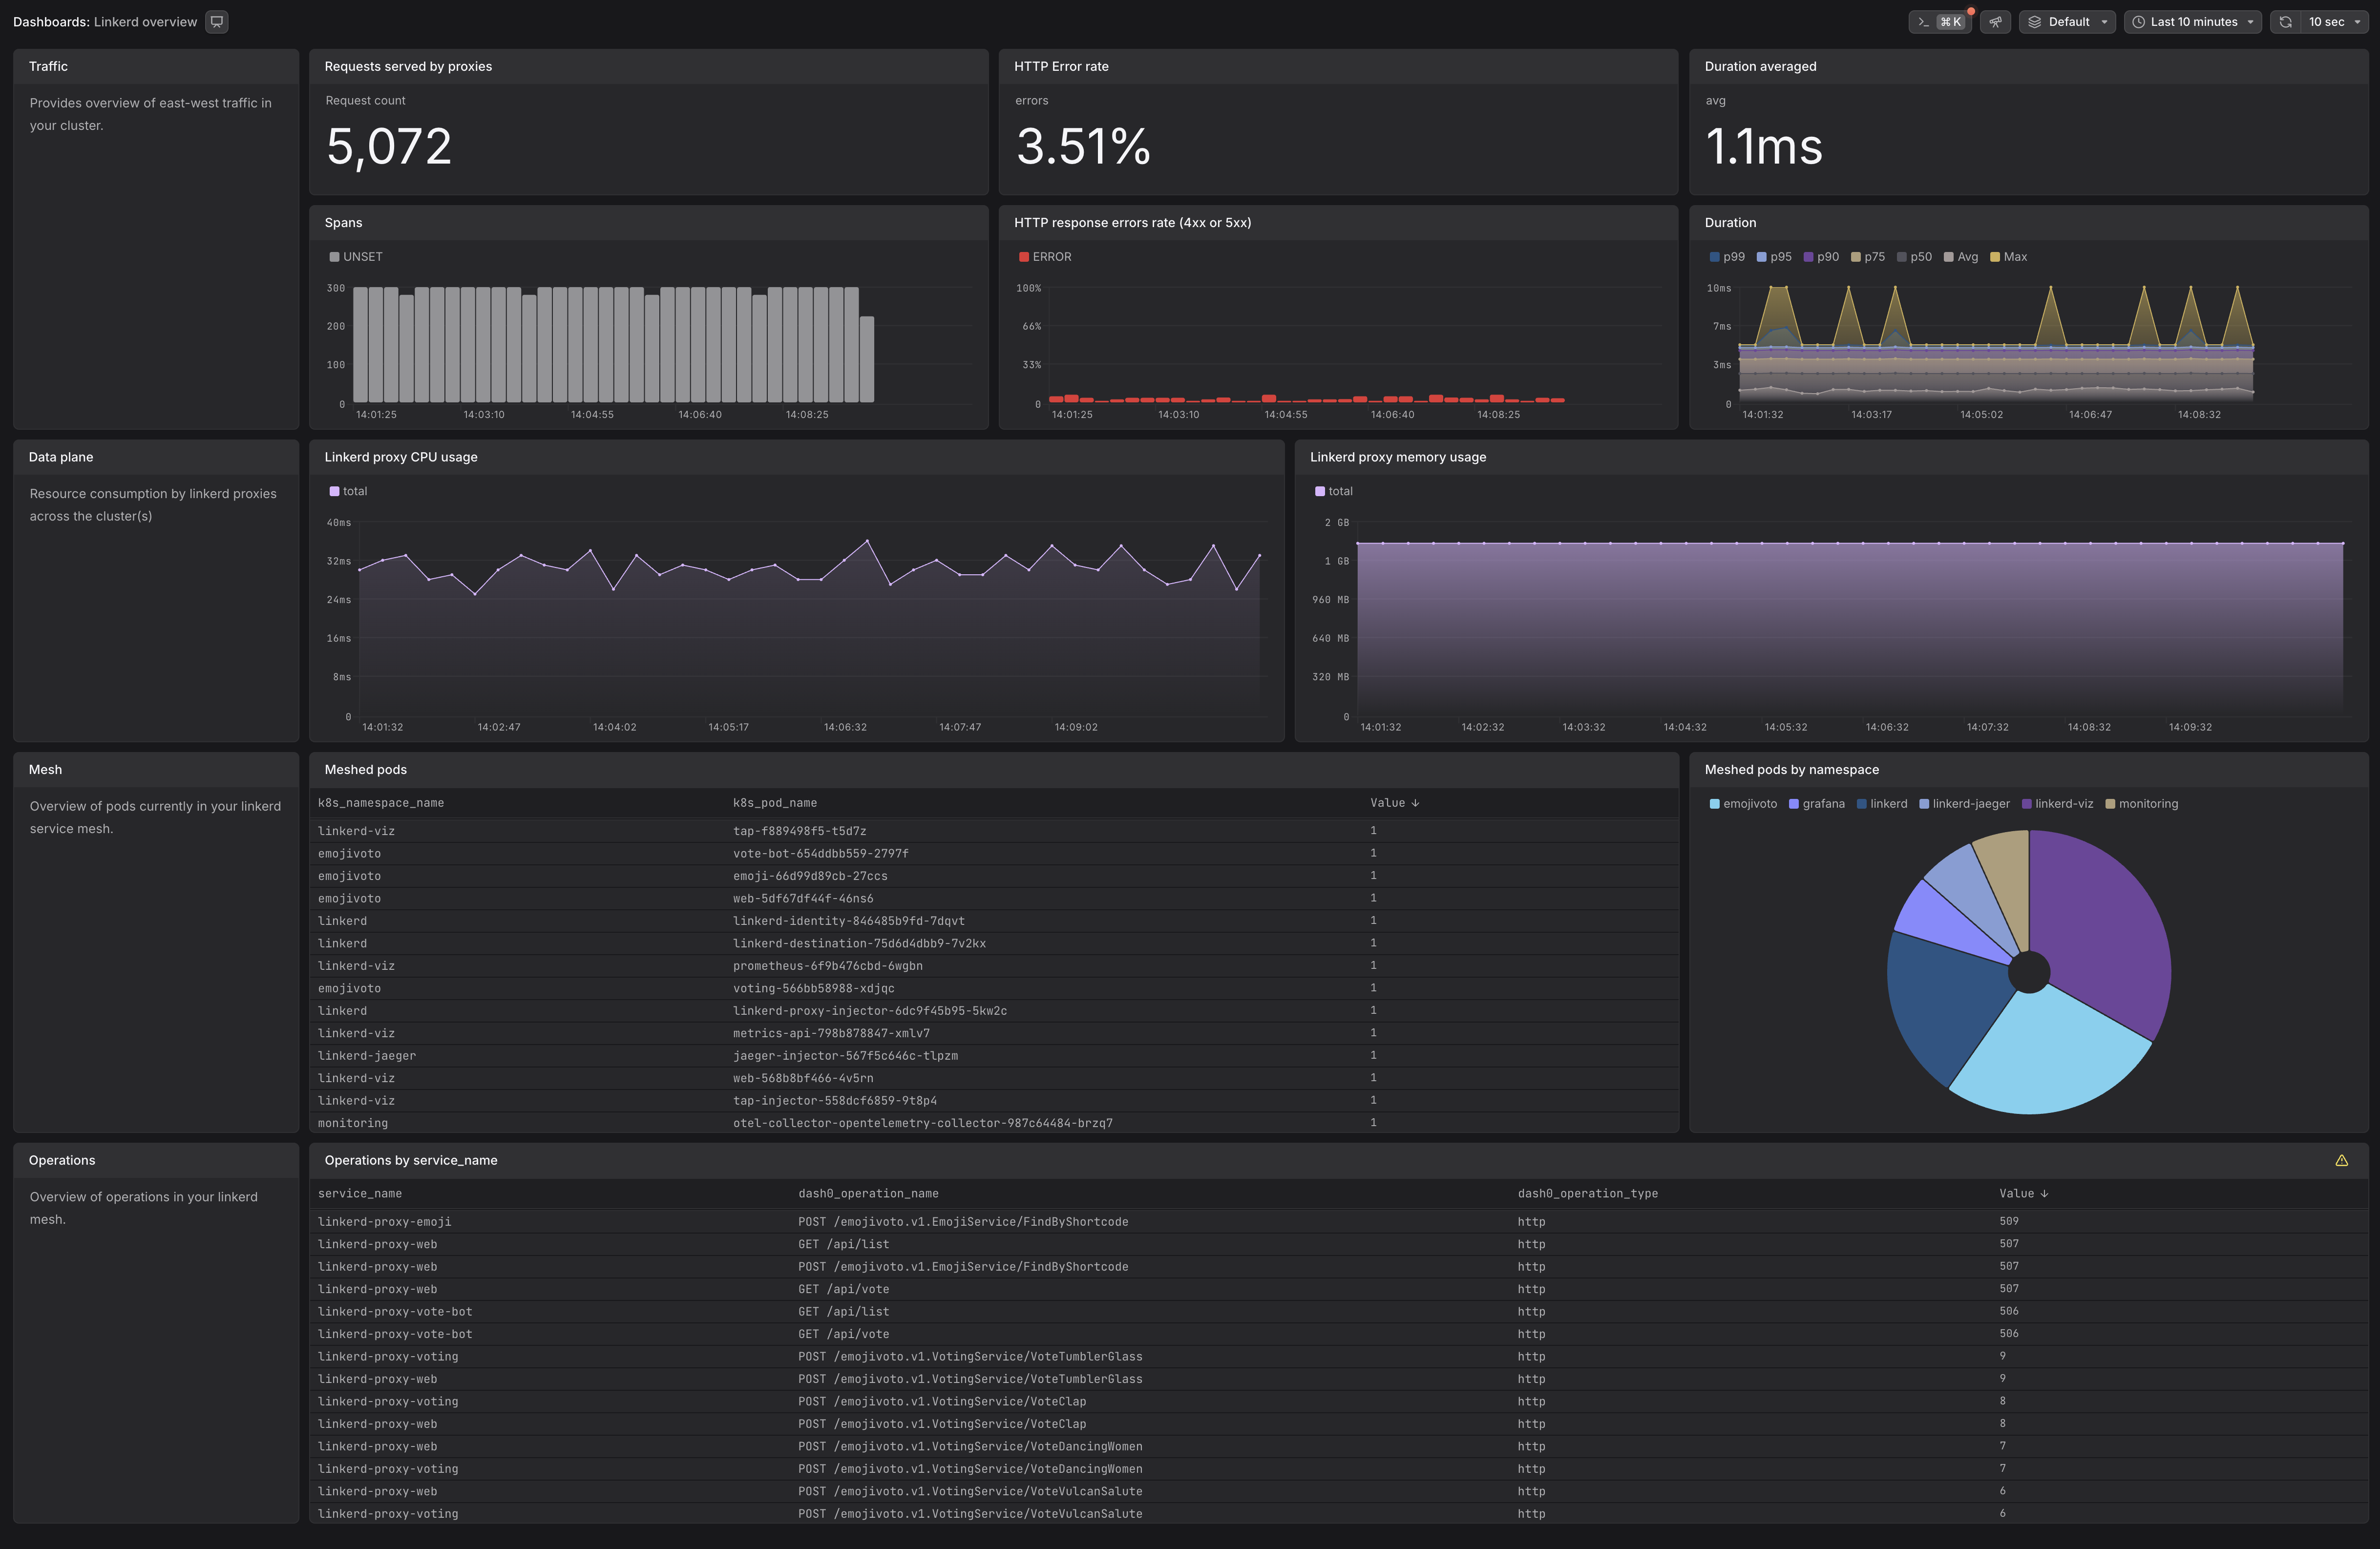
Linkerd Overview
Linkerd error rate is over 10% for a deployment, statefulset, or daemonset
Linkerd error rate for {{ $labels.deployment | $labels.statefulset | $labels.daemonset }} is over 10%.
Linkerd provides built-in telemetry and observability features, capturing metrics for service-to-service communication, proxy behavior, and control plane operations. Starting with Linkerd 2.19, native distributed tracing support is built into the proxy, allowing you to collect traces without additional extensions. This integration enables you to forward Linkerd metrics and traces to Dash0 using the OpenTelemetry Collector.
For more details, refer to the Linkerd documentation:
Before setting up Linkerd monitoring, ensure:
You'll need an OpenTelemetry Collector deployed. Consider using:
Helm Chart for The OpenTelemetry Collector
The OpenTelemetry Collector uses the Prometheus receiver to scrape Linkerd metrics. Add the following scrape configuration to your collector:
This configuration follows the official Linkerd Prometheus scrape settings and collects:
request_total, response_total, or route_*Starting with Linkerd 2.19, the Linkerd-Jaeger extension is deprecated. Tracing can now be configured directly in the Linkerd control plane installation. Linkerd exports traces using the OpenTelemetry protocol, allowing you to forward trace data to any OpenTelemetry-compatible collector.
If you are currently using the Linkerd-Jaeger extension, refer to the migration guide for instructions on transitioning to the new approach.
If you installed Linkerd using Helm, add the following values to your Linkerd control plane configuration:
Then upgrade your Linkerd installation:
If you installed Linkerd using the CLI, use the upgrade command with tracing parameters:
The meshIdentity stanza is mandatory: Linkerd can only export traces to a collector within the mesh. Ensure your
OpenTelemetry Collector namespace has the linkerd.io/inject: enabled annotation so that the collector pods are part
of the Linkerd mesh.
After updating the Linkerd configuration, restart all meshed pods to apply the new tracing settings:
After completing these steps, you should start seeing Linkerd traces in Dash0.
For more details, refer to the Linkerd Distributed Tracing Documentation.