Dash0 Raises $110M Series B at $1B Valuation
Gain visibility into Java applications and JVM-based systems. This integration monitors Java programs for enhanced system insights.
The Dash0 Kubernetes Operator automatically instruments your Java and JVM-based workloads. Using the operator is the recommended way of getting visibility into JVM-based Kubernetes workloads, and is preferred over configuring the OpenTelemetry SDK manually for each application.
Instrumenting your Java and JVM-based applications to generate traces, logs, and metrics is a powerful way to gain deep insights into its behavior and performance. By adding instrumentation, you enable your application to emit valuable data that can be used for monitoring, troubleshooting, and optimization.
Dash0 supports automatic instrumentation of Java applications through OpenTelemetry's open-source and vendor-agnostic libraries.
Want AI to set this up for you? Install the Dash0 Agent Skills to let Claude Code, Cursor, or Windsurf instrument your application automatically with OpenTelemetry best practices.
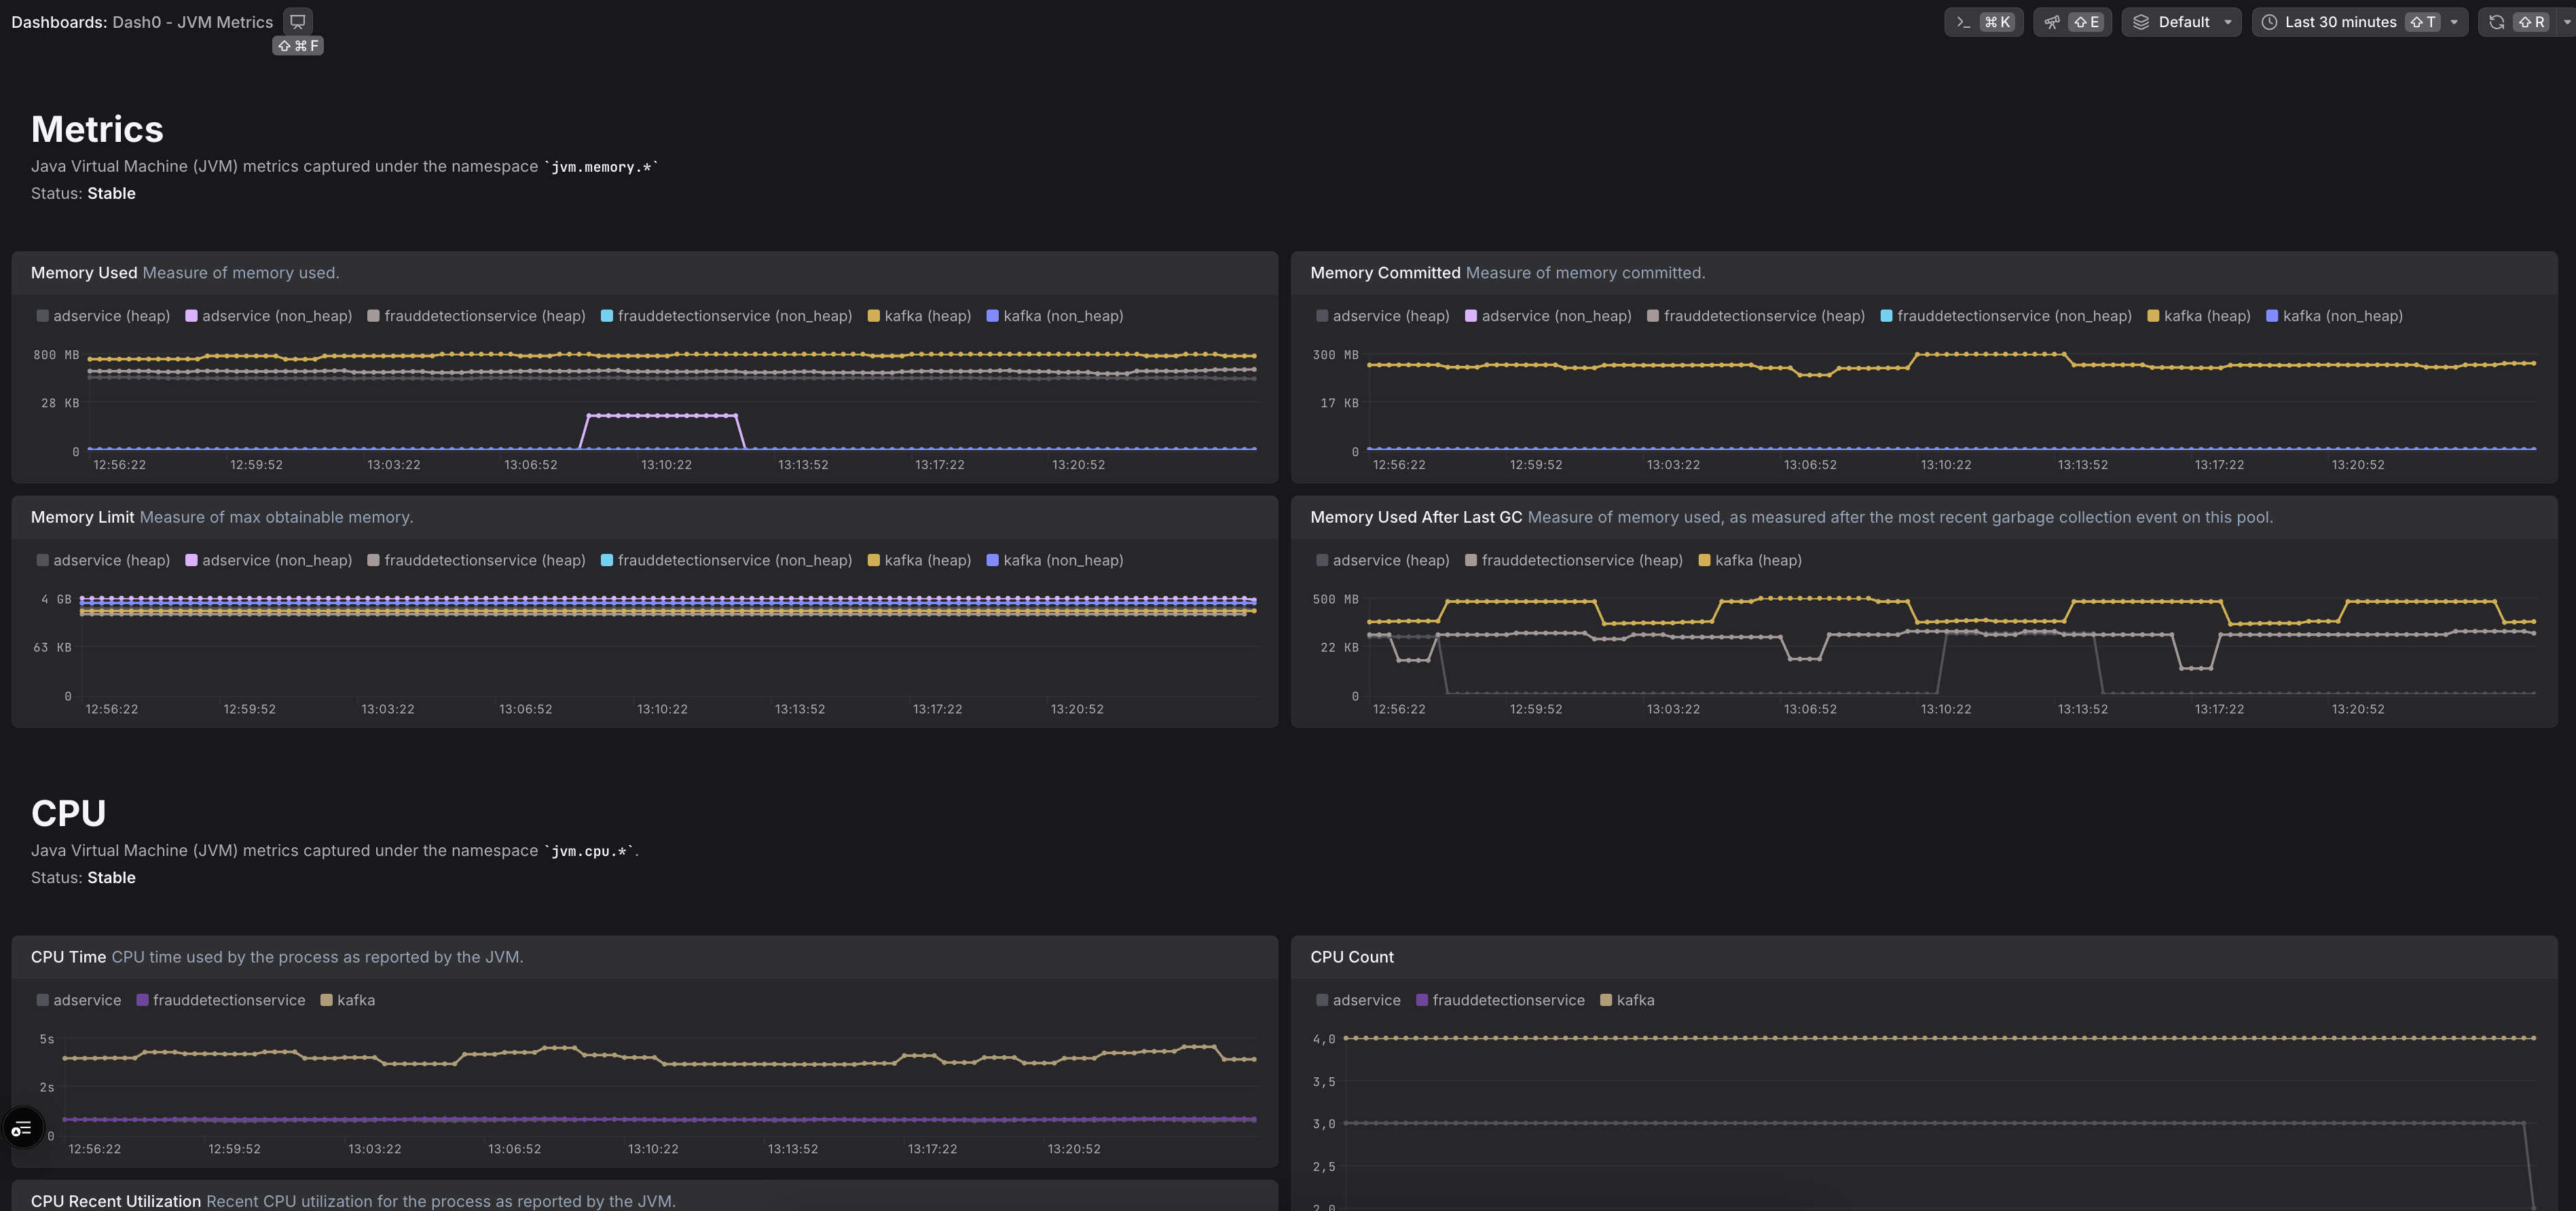
JVM Metrics Dashboard
The OpenTelemetry Java SDK provides a ready-made auto-instrumentation agent that simplifies instrumentation:
The opentelemetry-javaagent.jar file contains both the agent and instrumentation libraries, enabling automatic instrumentation of your JVM-based application without modifying its source code.
To send data to Dash0, configure the following settings:
1. Register the OpenTelemetry Java Agent
Ensure that the OpenTelemetry Java agent is registered when starting your application by using the -javaagent parameter:
Alternatively, you can set an environment variable to automatically add the -javaagent parameter to the JVM:
2. Specify the application service name:
Replace my-first-observable-java-service with a meaningful name that identifies your application.
3. Set up the data export endpoint and authorization token:
Note: You can specify which dataset to send data to by adding the Dash0-Dataset header. For example:
For more information, see the dataset documentation.
In case you are not using the Dash0 operator for Kubernetes to deploy your application, you should extend the OpenTelemetry resource attributes to include the Pod UID. This is important to merge the resources between logs,traces and metrics. You can do this by adding the following environment variables to your deployment:
This will add the k8s.pod.name and k8s.pod.uid attributes to the OpenTelemetry resource attributes, which will be included in all telemetry data sent to Dash0.
To read more about resource equality and merging, please refer to the Dash0 docs.
In order to learn more about the importance of resource attributes read the blog post OpenTelemetry resource attributes: Best practices for Kubernetes
To see which libraries are automatically instrumented, refer to the OpenTelemetry registry.