Dash0 Raises $110M Series B at $1B Valuation
Collect system-level metrics from hosts including CPU, memory, disk, filesystem, network, and process metrics using the OpenTelemetry hostmetrics receiver.
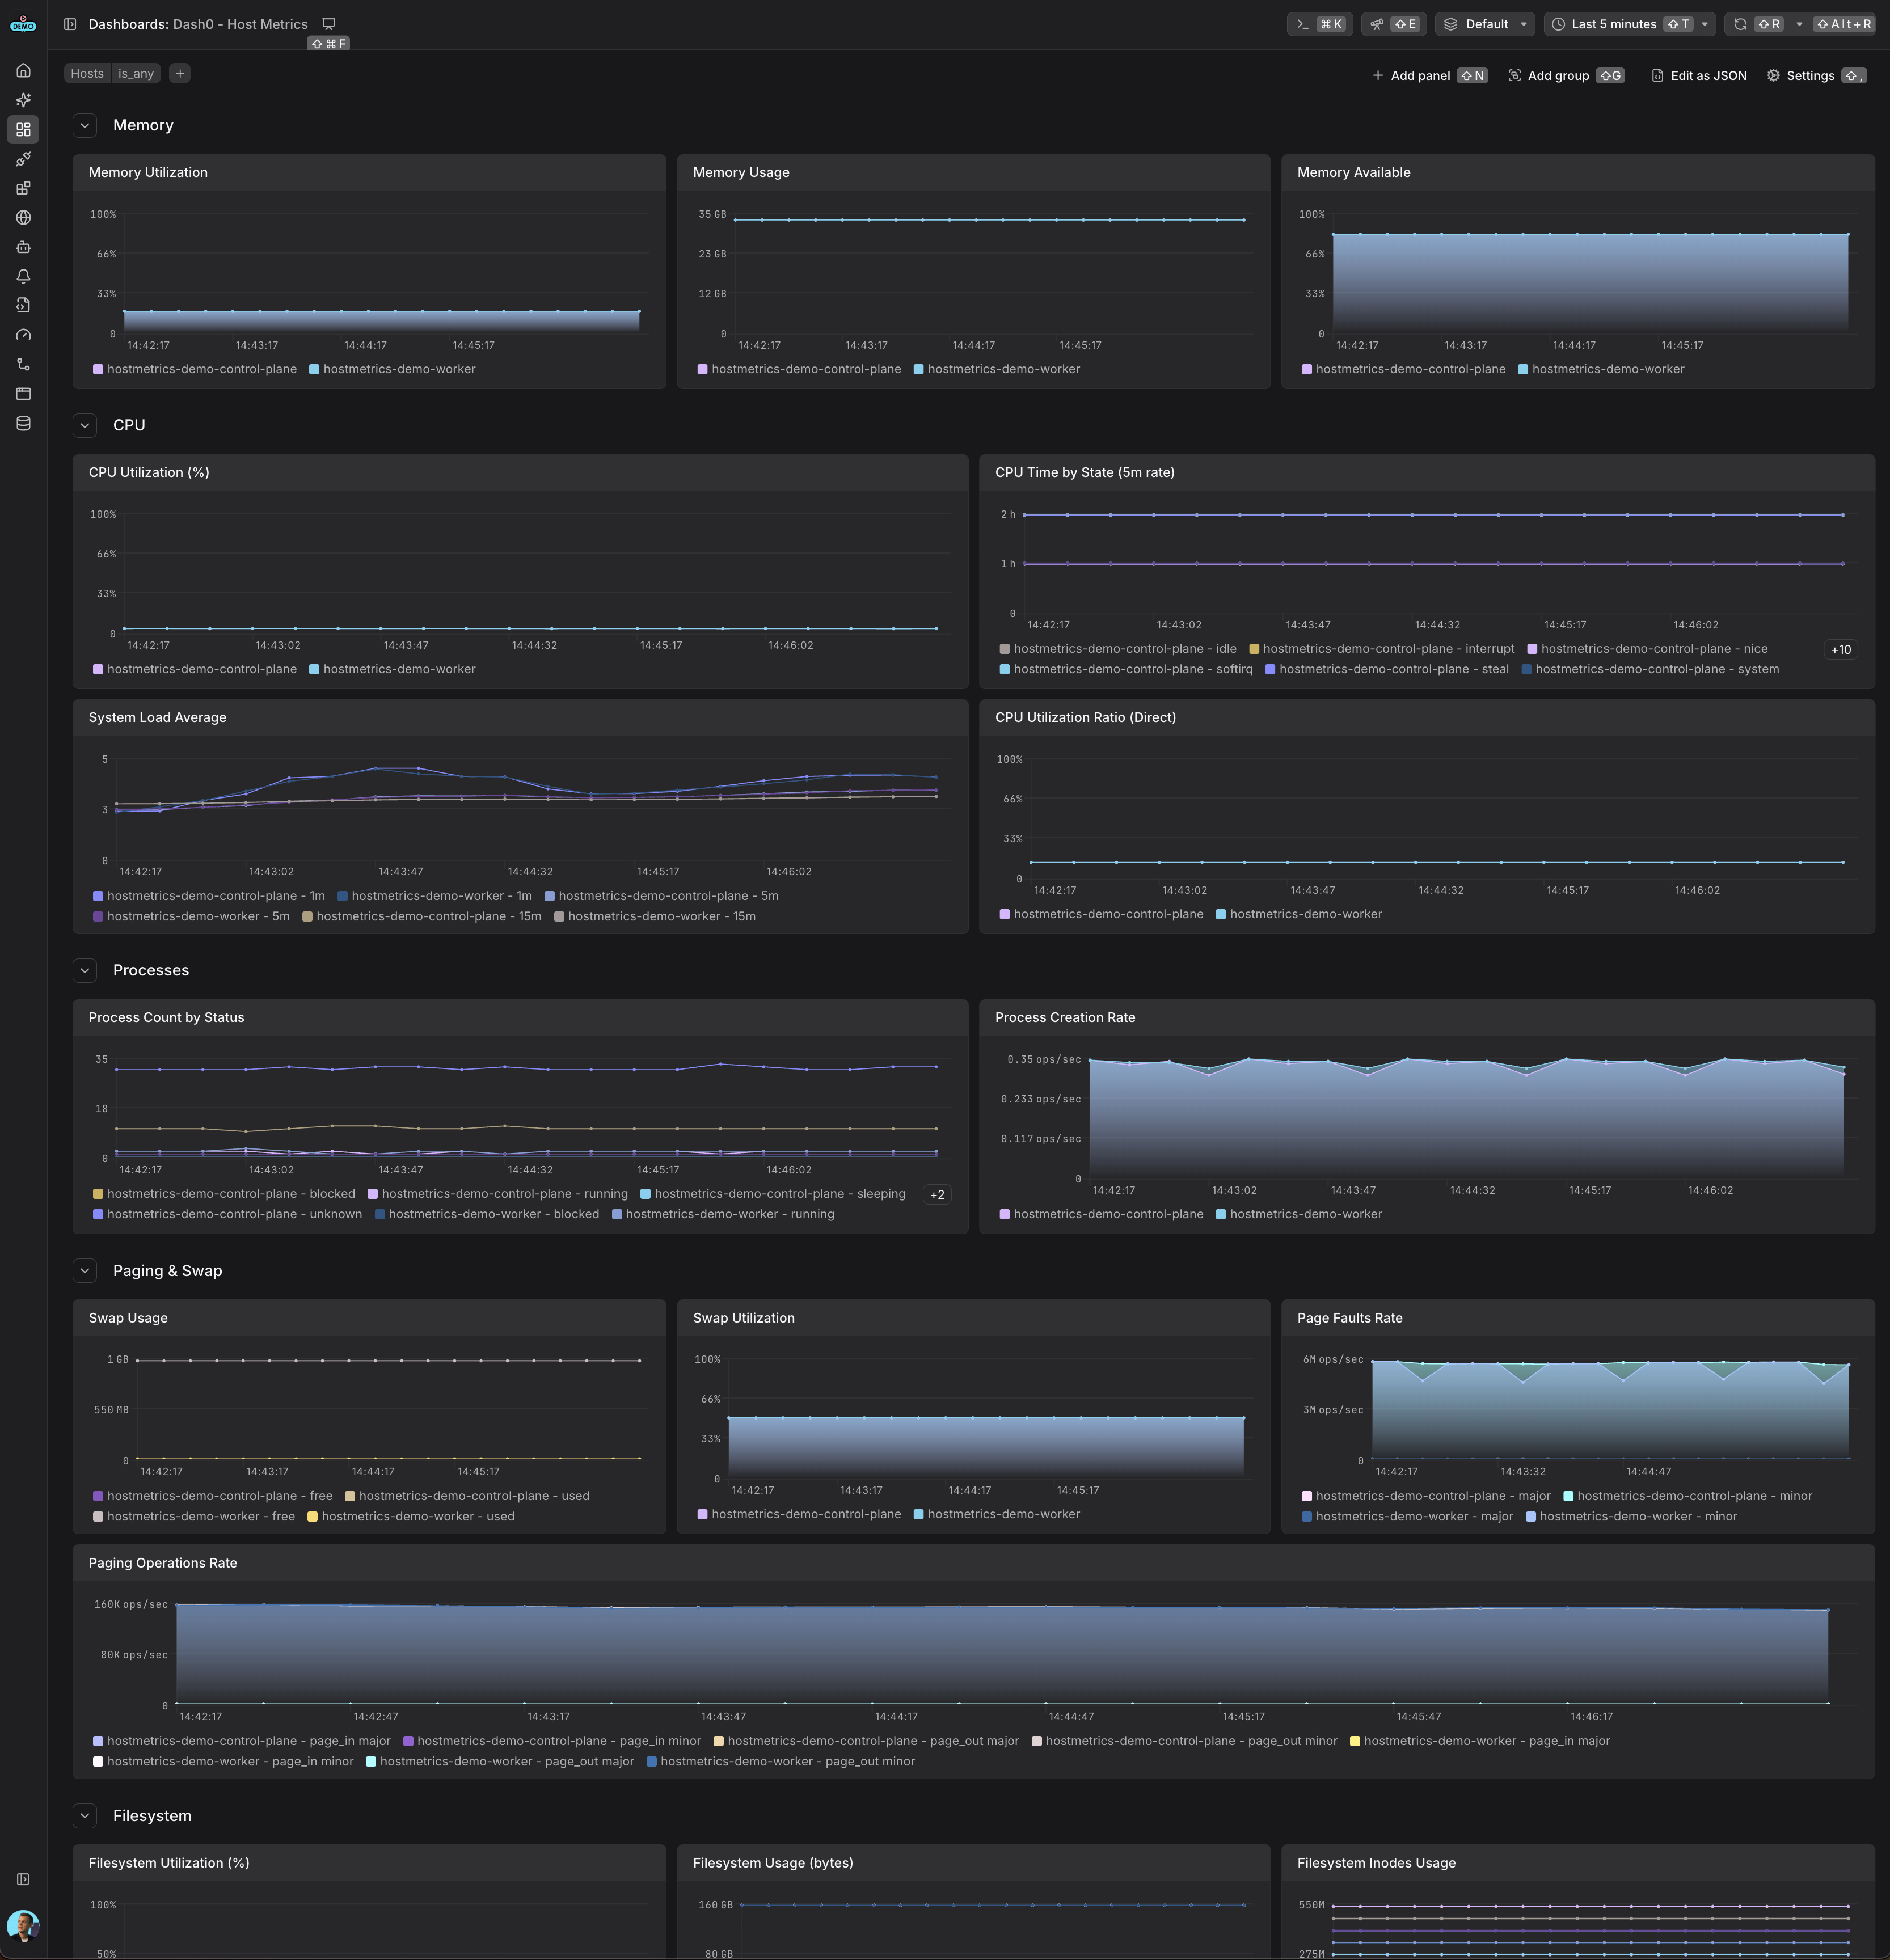
System-level metrics dashboard showing CPU, memory, disk, network, and process statistics from the OpenTelemetry hostmetrics receiver
Host CPU usage is above threshold
Monitors host system CPU utilization. This alert fires when host CPU usage exceeds the threshold:
Host disk I/O usage is high
Monitors host disk I/O rate. This alert fires when disk I/O rate exceeds the threshold:
Host filesystem inodes usage is above threshold
Monitors host filesystem inodes utilization. This alert fires when inodes usage exceeds the threshold:
Host filesystem usage is above threshold
Monitors host filesystem utilization. This alert fires when host filesystem usage exceeds the threshold:
Host load average is high
Host memory usage is above threshold
Monitors host system memory utilization. This alert fires when host memory usage exceeds the threshold:
Host network is dropping packets
Network packets are being dropped.
Host network errors are high
High network error rate detected.
Host network I/O usage is high
Monitors host network I/O rate. This alert fires when network I/O rate exceeds the threshold:
Host is using swap memory
System is using swap memory, indicating physical memory pressure.
The OpenTelemetry hostmetrics receiver collects detailed system-level metrics from your hosts, providing comprehensive visibility into resource utilization and system performance.
Do I need this receiver in Kubernetes? If you only need Kubernetes-aware metrics (nodes, pods, containers, volumes), the kubeletstats receiver is usually enough. Add hostmetrics only when you also want deep OS-level visibility — such as load averages, paging, per-filesystem stats, inodes, or per-process metrics — that the kubelet does not expose.
The hostmetrics receiver collects:
The OpenTelemetry hostmetrics receiver collects system-level metrics from your hosts. This guide shows you how to configure the receiver in your OpenTelemetry Collector to send metrics to Dash0.
You need an OpenTelemetry Collector running with access to Dash0. We recommend using one of these deployment methods:
Add the hostmetrics receiver to your OpenTelemetry Collector configuration:
This example enables all available scrapers with default settings:
When running in Kubernetes, additional configuration is needed for complete host metrics collection:
To get utilization ratio metrics (e.g., system.memory.utilization), enable them explicitly:
To add hostname information to your metrics, use the resource detection processor:
The collector needs specific permissions to access host metrics:
/hostfs with read-only accessSYS_PTRACE, DAC_READ_SEARCH)hostNetwork: true for complete network interface metricsFor a complete working example with all necessary Kubernetes configurations, see the Dash0 hostmetrics example.
You can include or exclude specific metrics:
Check that metrics are being collected by inspecting the logs of your OpenTelemetry Collector.
system. (e.g., system.cpu.utilization, system.memory.usage)