Dash0 Raises $110M Series B at $1B Valuation
Dash0 integrates with Google Cloud Run by fetching service-level metrics from Google Cloud Monitoring, enabling insight into request performance, concurrency, and resource utilization.
Visualize Cloud Run metrics
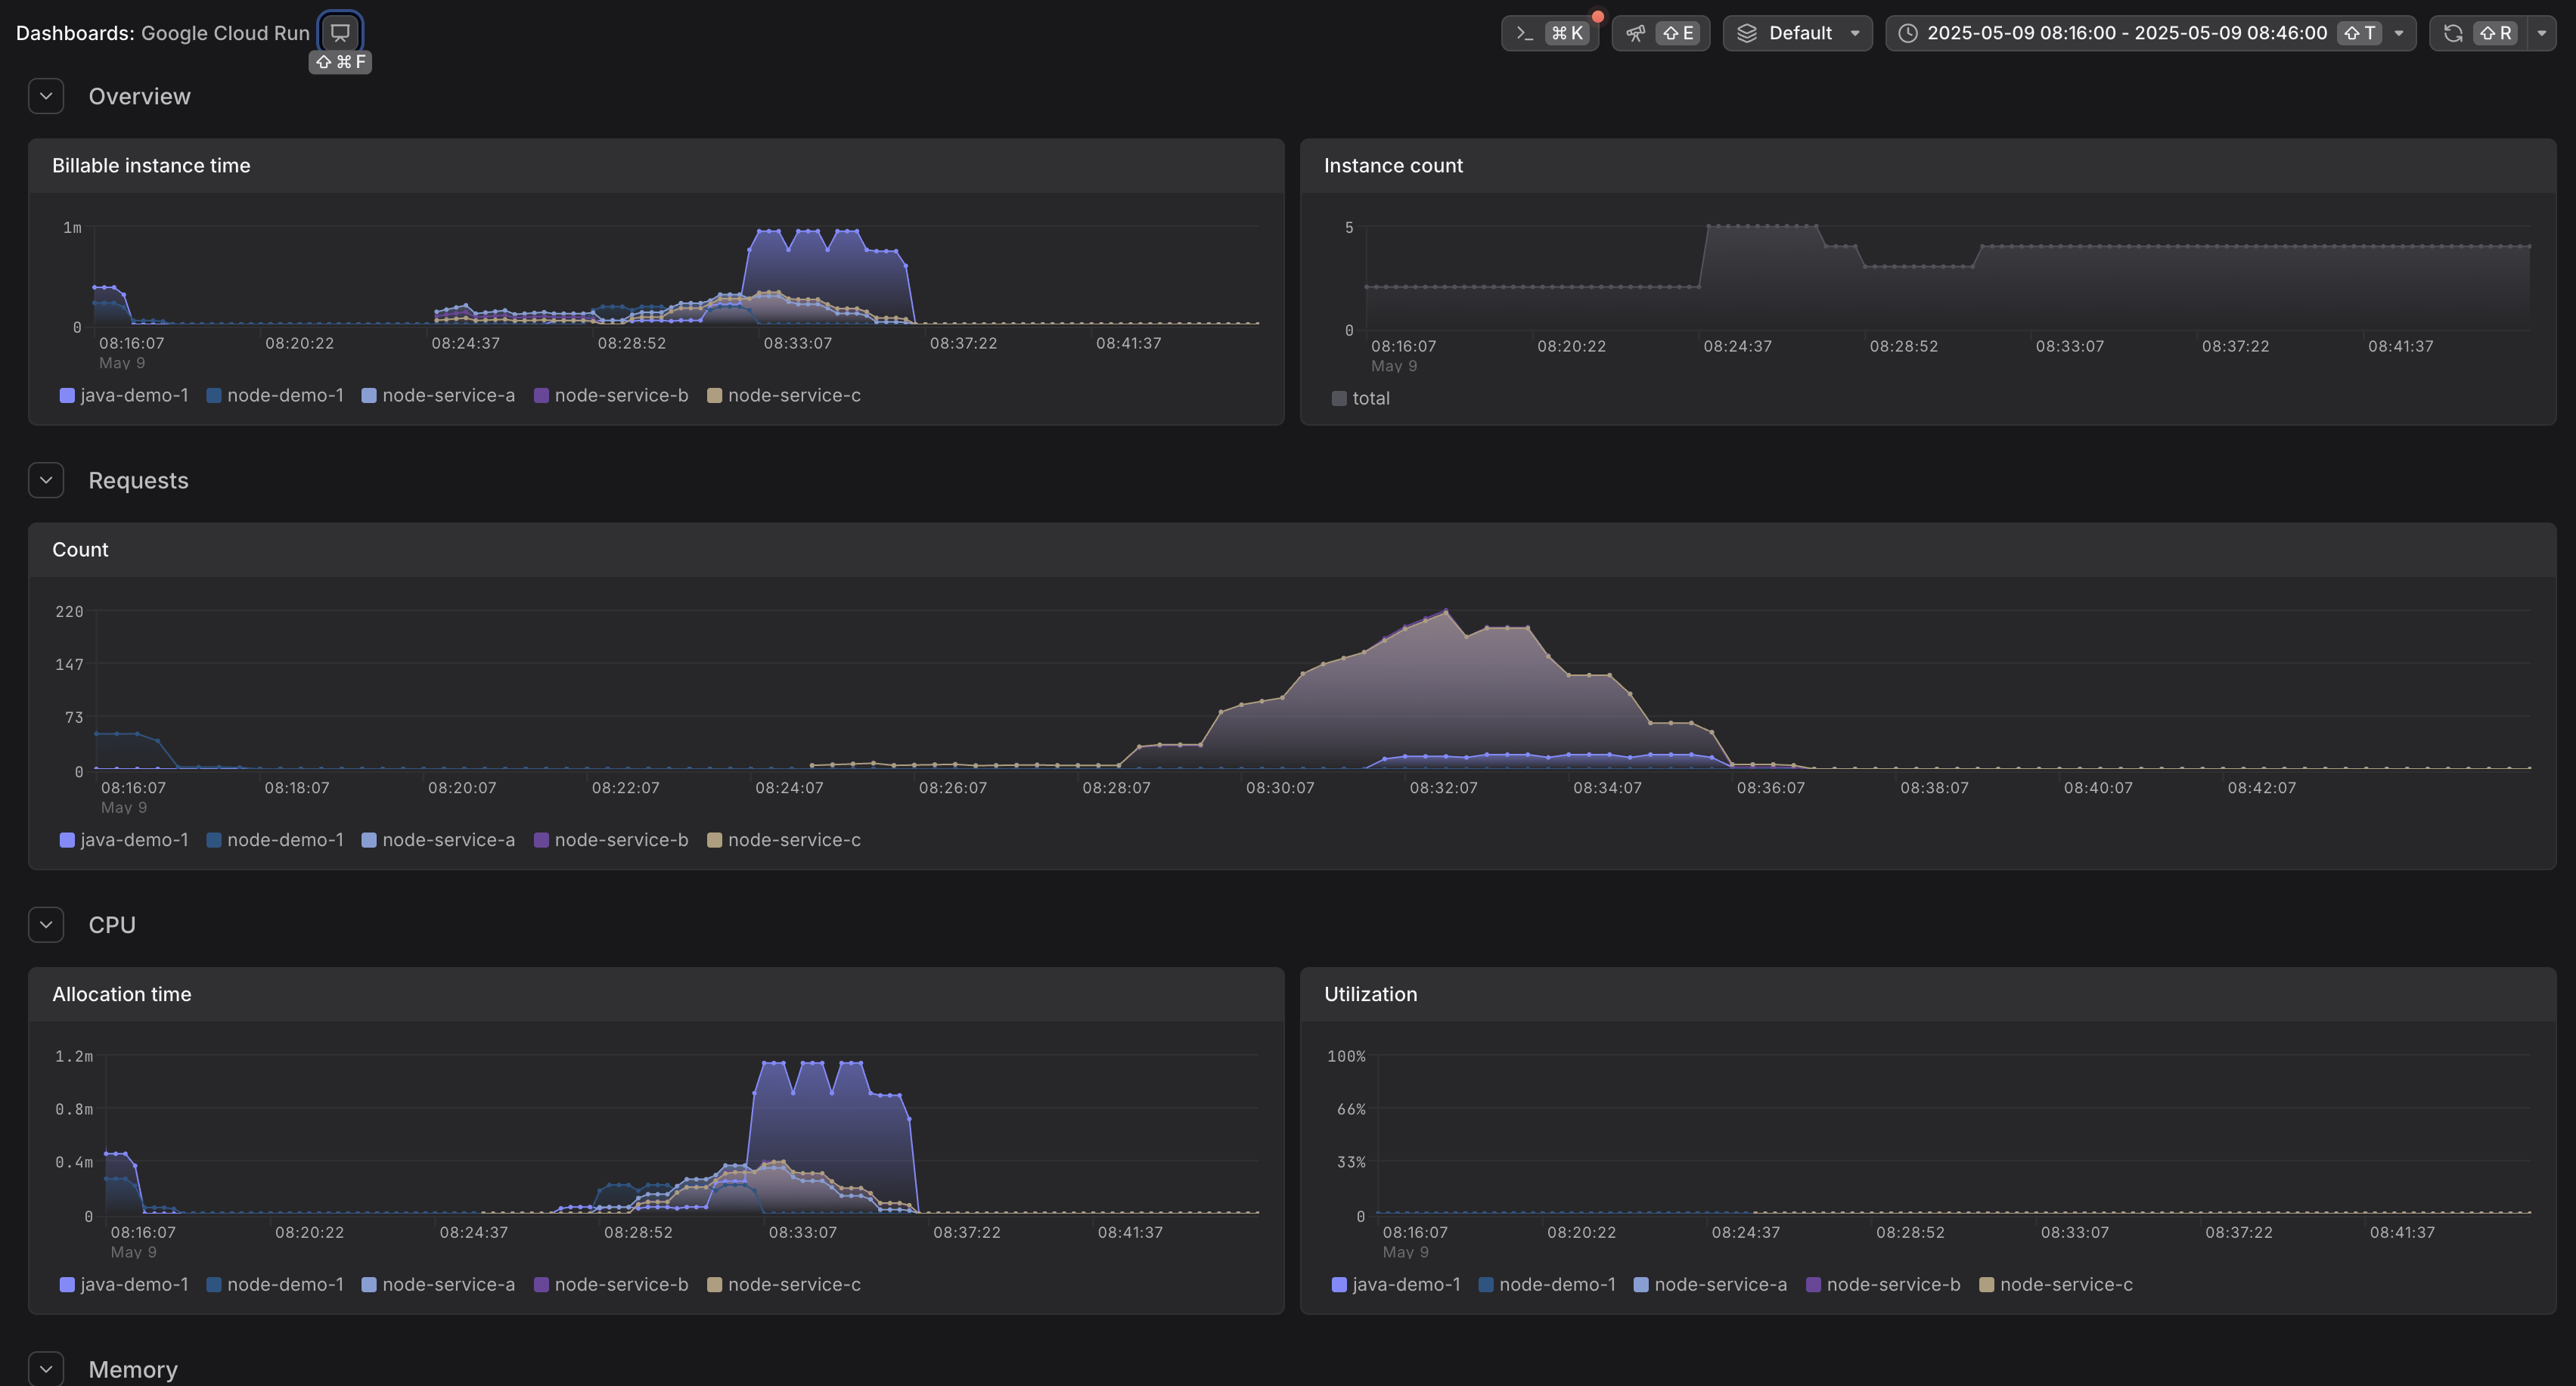
Google Cloud Run is a fully managed compute platform that automatically scales your stateless containers. Cloud Run emits several service-level metrics directly to Google Cloud Monitoring, including request counts, response latencies, container resource usage, and concurrency.
This integration helps you collect Cloud Run platform metrics using the OpenTelemetry Collector's googlecloudmonitoring receiver.
| Metric Name | Description |
|---|---|
run.googleapis.com/request_count | Number of requests received |
run.googleapis.com/request_latencies | Latency of responses |
run.googleapis.com/container/cpu/utilizations | CPU usage by container |
run.googleapis.com/container/memory/utilizations | Memory usage by container |
run.googleapis.com/container/instance_count | Number of container instances |
run.googleapis.com/container/billable_instance_time | Time the container was active (billable) |
run.googleapis.com/container/max_request_concurrencies | Max concurrency of requests handled |
run.googleapis.com/container/network/received_bytes_count | Received bytes |
run.googleapis.com/container/network/sent_bytes_count | Sent bytes |
See Cloud Run metrics in GCP Monitoring for the full list and definitions.
Cloud Run metrics are available in Google Cloud Monitoring. To collect these metrics and send them to Dash0, use the OpenTelemetry Collector with the googlecloudmonitoring receiver.
1. Where to Run the Collector
You can run the OpenTelemetry Collector in a few different environments:
2. Permissions
To collect metrics from Google Cloud Monitoring, the OpenTelemetry Collector must authenticate with the correct permissions and run in a properly configured GCP project.
Required Permissions
The Collector must use a Google Cloud service account with the following role:
roles/monitoring.viewer — grants read access to Cloud Monitoring metrics.You can assign this role directly to a service account or via Workload Identity if running on GKE.
Authentication
The googlecloudmonitoring receiver uses Application Default Credentials (ADC) to authenticate.
The behavior depends on where you run the Collector:
GOOGLE_APPLICATION_CREDENTIALS environment variable to point to a service account key file.Wherever possible, prefer using GCP-native authentication mechanisms like Workload Identity over key files.
Running on GKE? Use Workload Identity
To bind a Kubernetes service account (KSA) to a GCP service account:
roles/iam.workloadIdentityUser binding.See Workload Identity docs for full setup details.
GCP Project Requirements
Make sure the project you're collecting metrics from meets the following:
If you're not seeing expected data, check that the service is deployed and actively generating telemetry in the target project.
3. Collector Configuration
Replace the <YOUR_GCP_PROJECT_ID> with your GCP project id. Dash0 GRPC endpoint and token can be obtained in the organization settings for your account under "Auth Tokens" and "Endpoints".
4. Further Reading