Dash0 Raises $110M Series B at $1B Valuation
Dash0 integrates with Confluent Cloud to observe and manage Kafka deployments, gaining visibility into your streaming data pipelines.
Kafka is a powerhouse, and Confluent can run it for you. If you are using their offering, you will still want insights into Kafka's and its clients' behavior. To that extent, Confluent exposes metrics for its customers that you can view via Dash0.
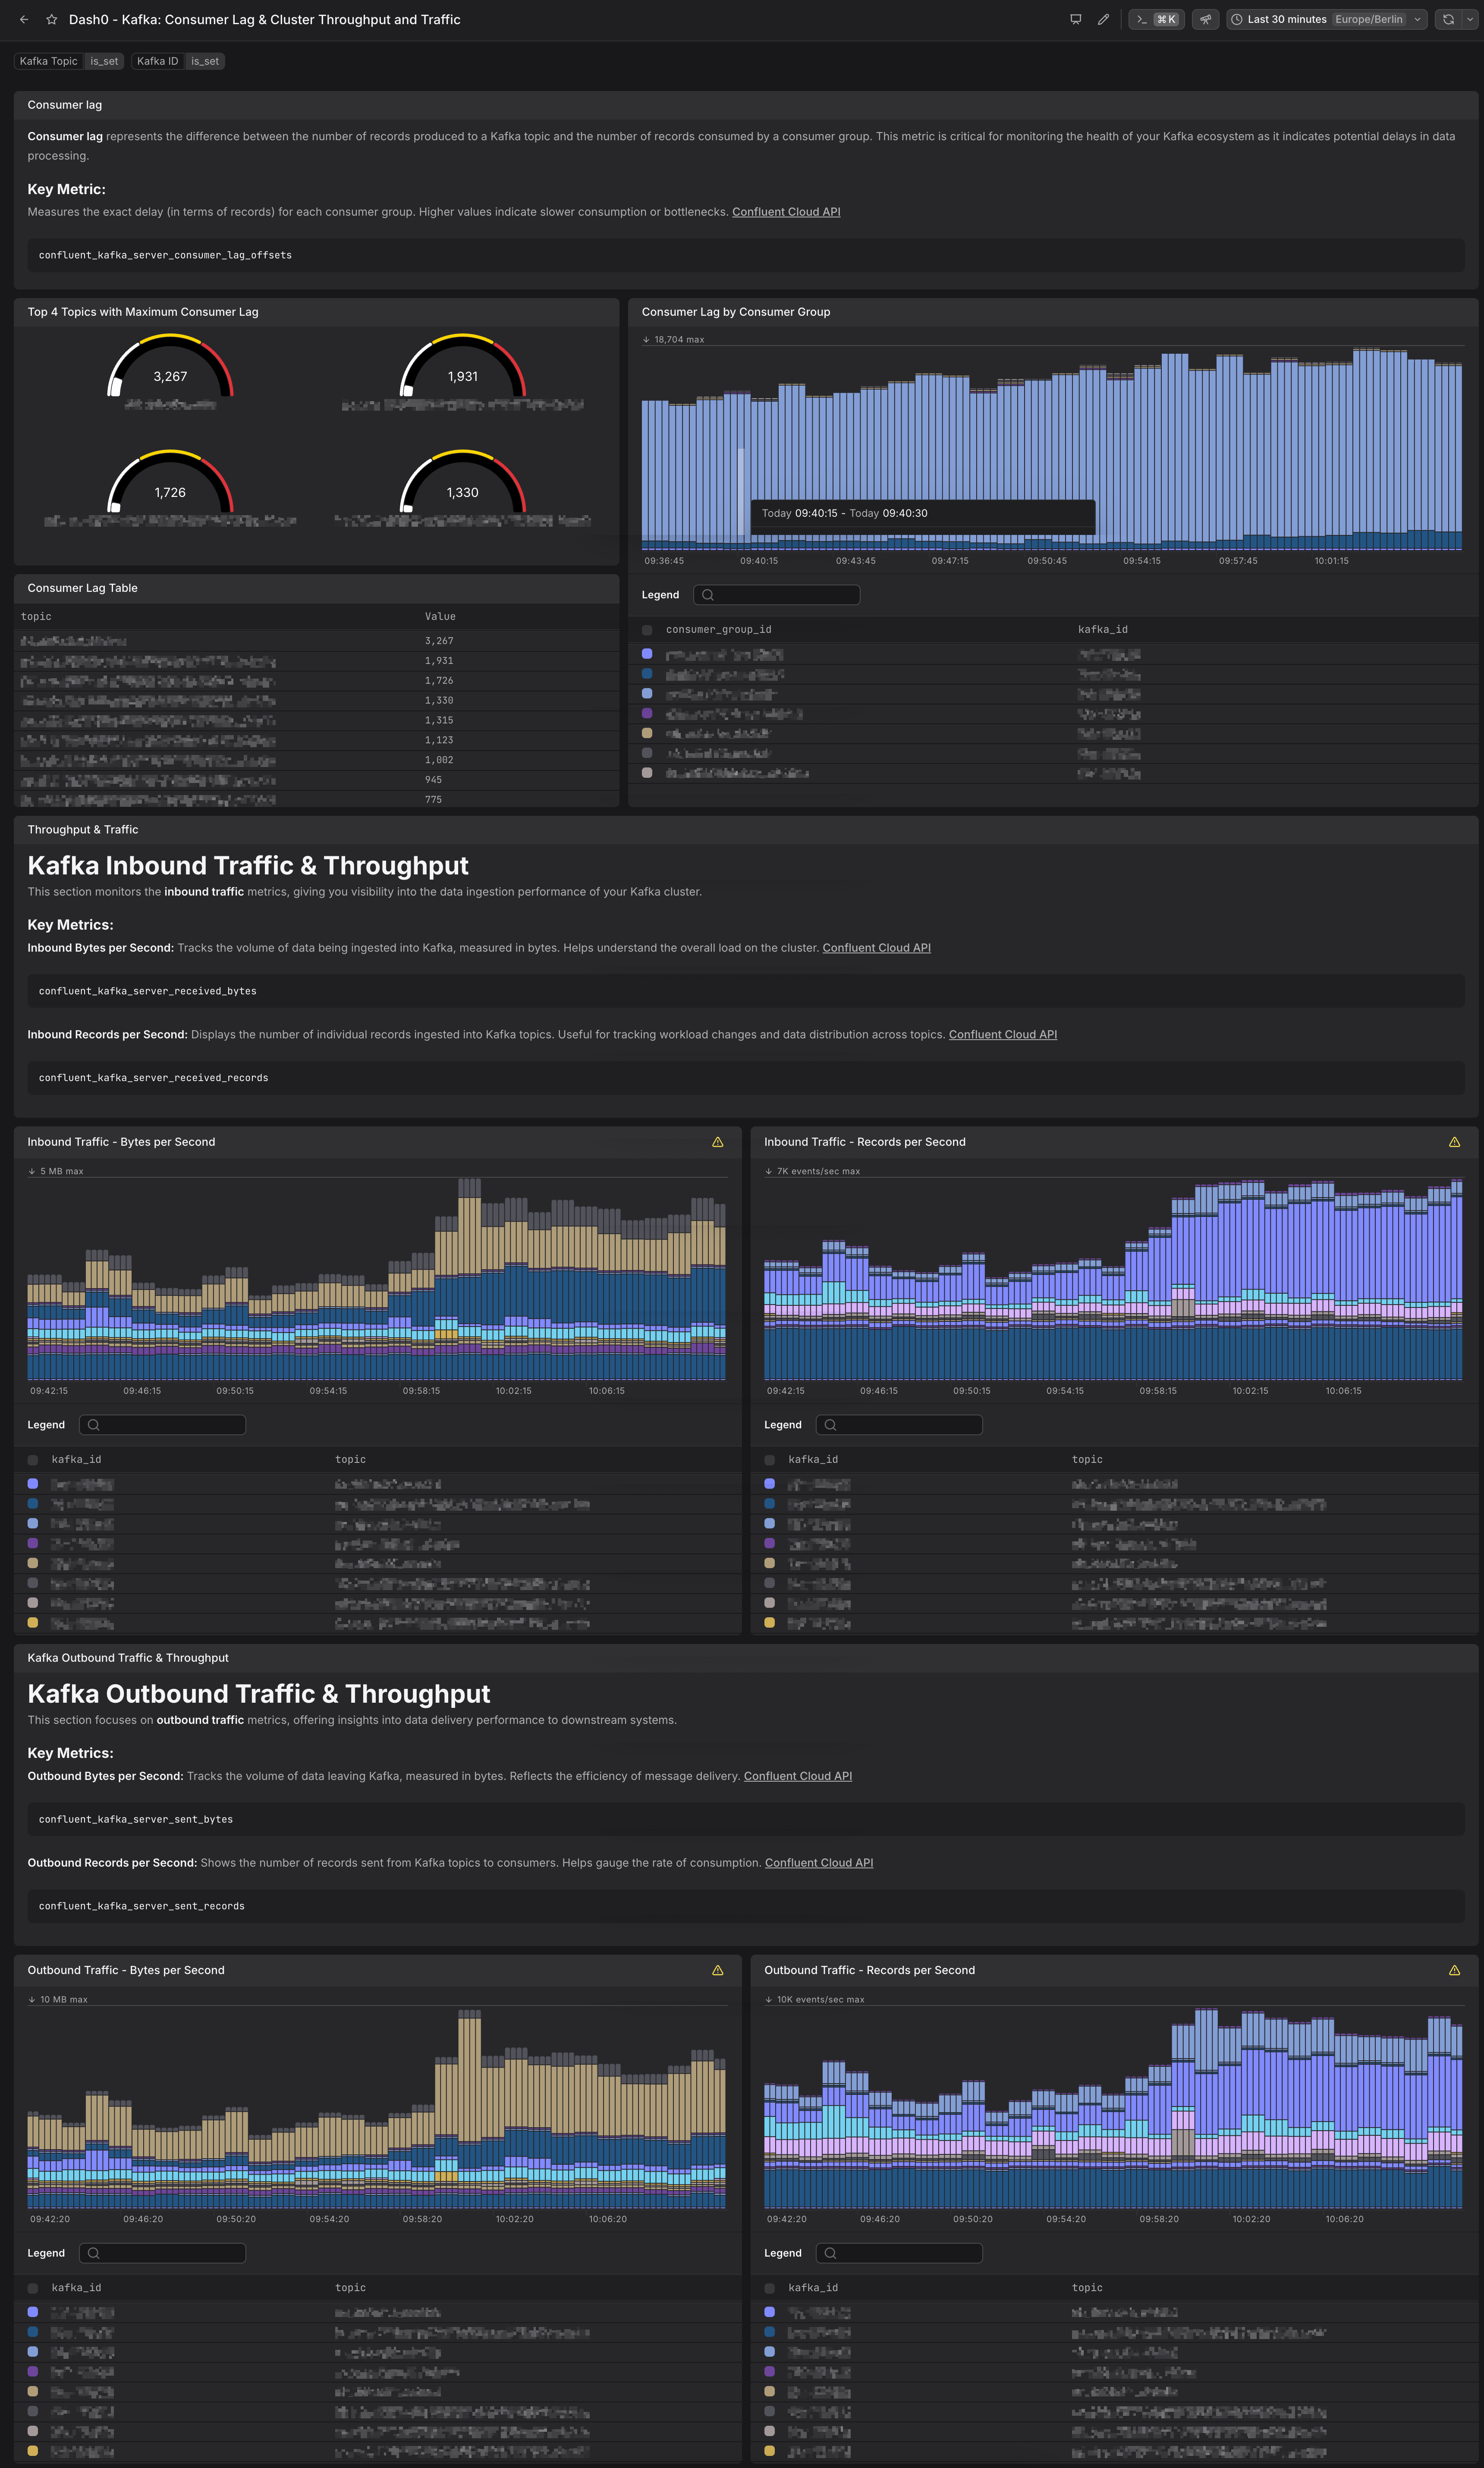
Confluent Kafka - Consumer Lag & Cluster Throughput and Traffic
Confluent Kafka - Request and Response Patterns
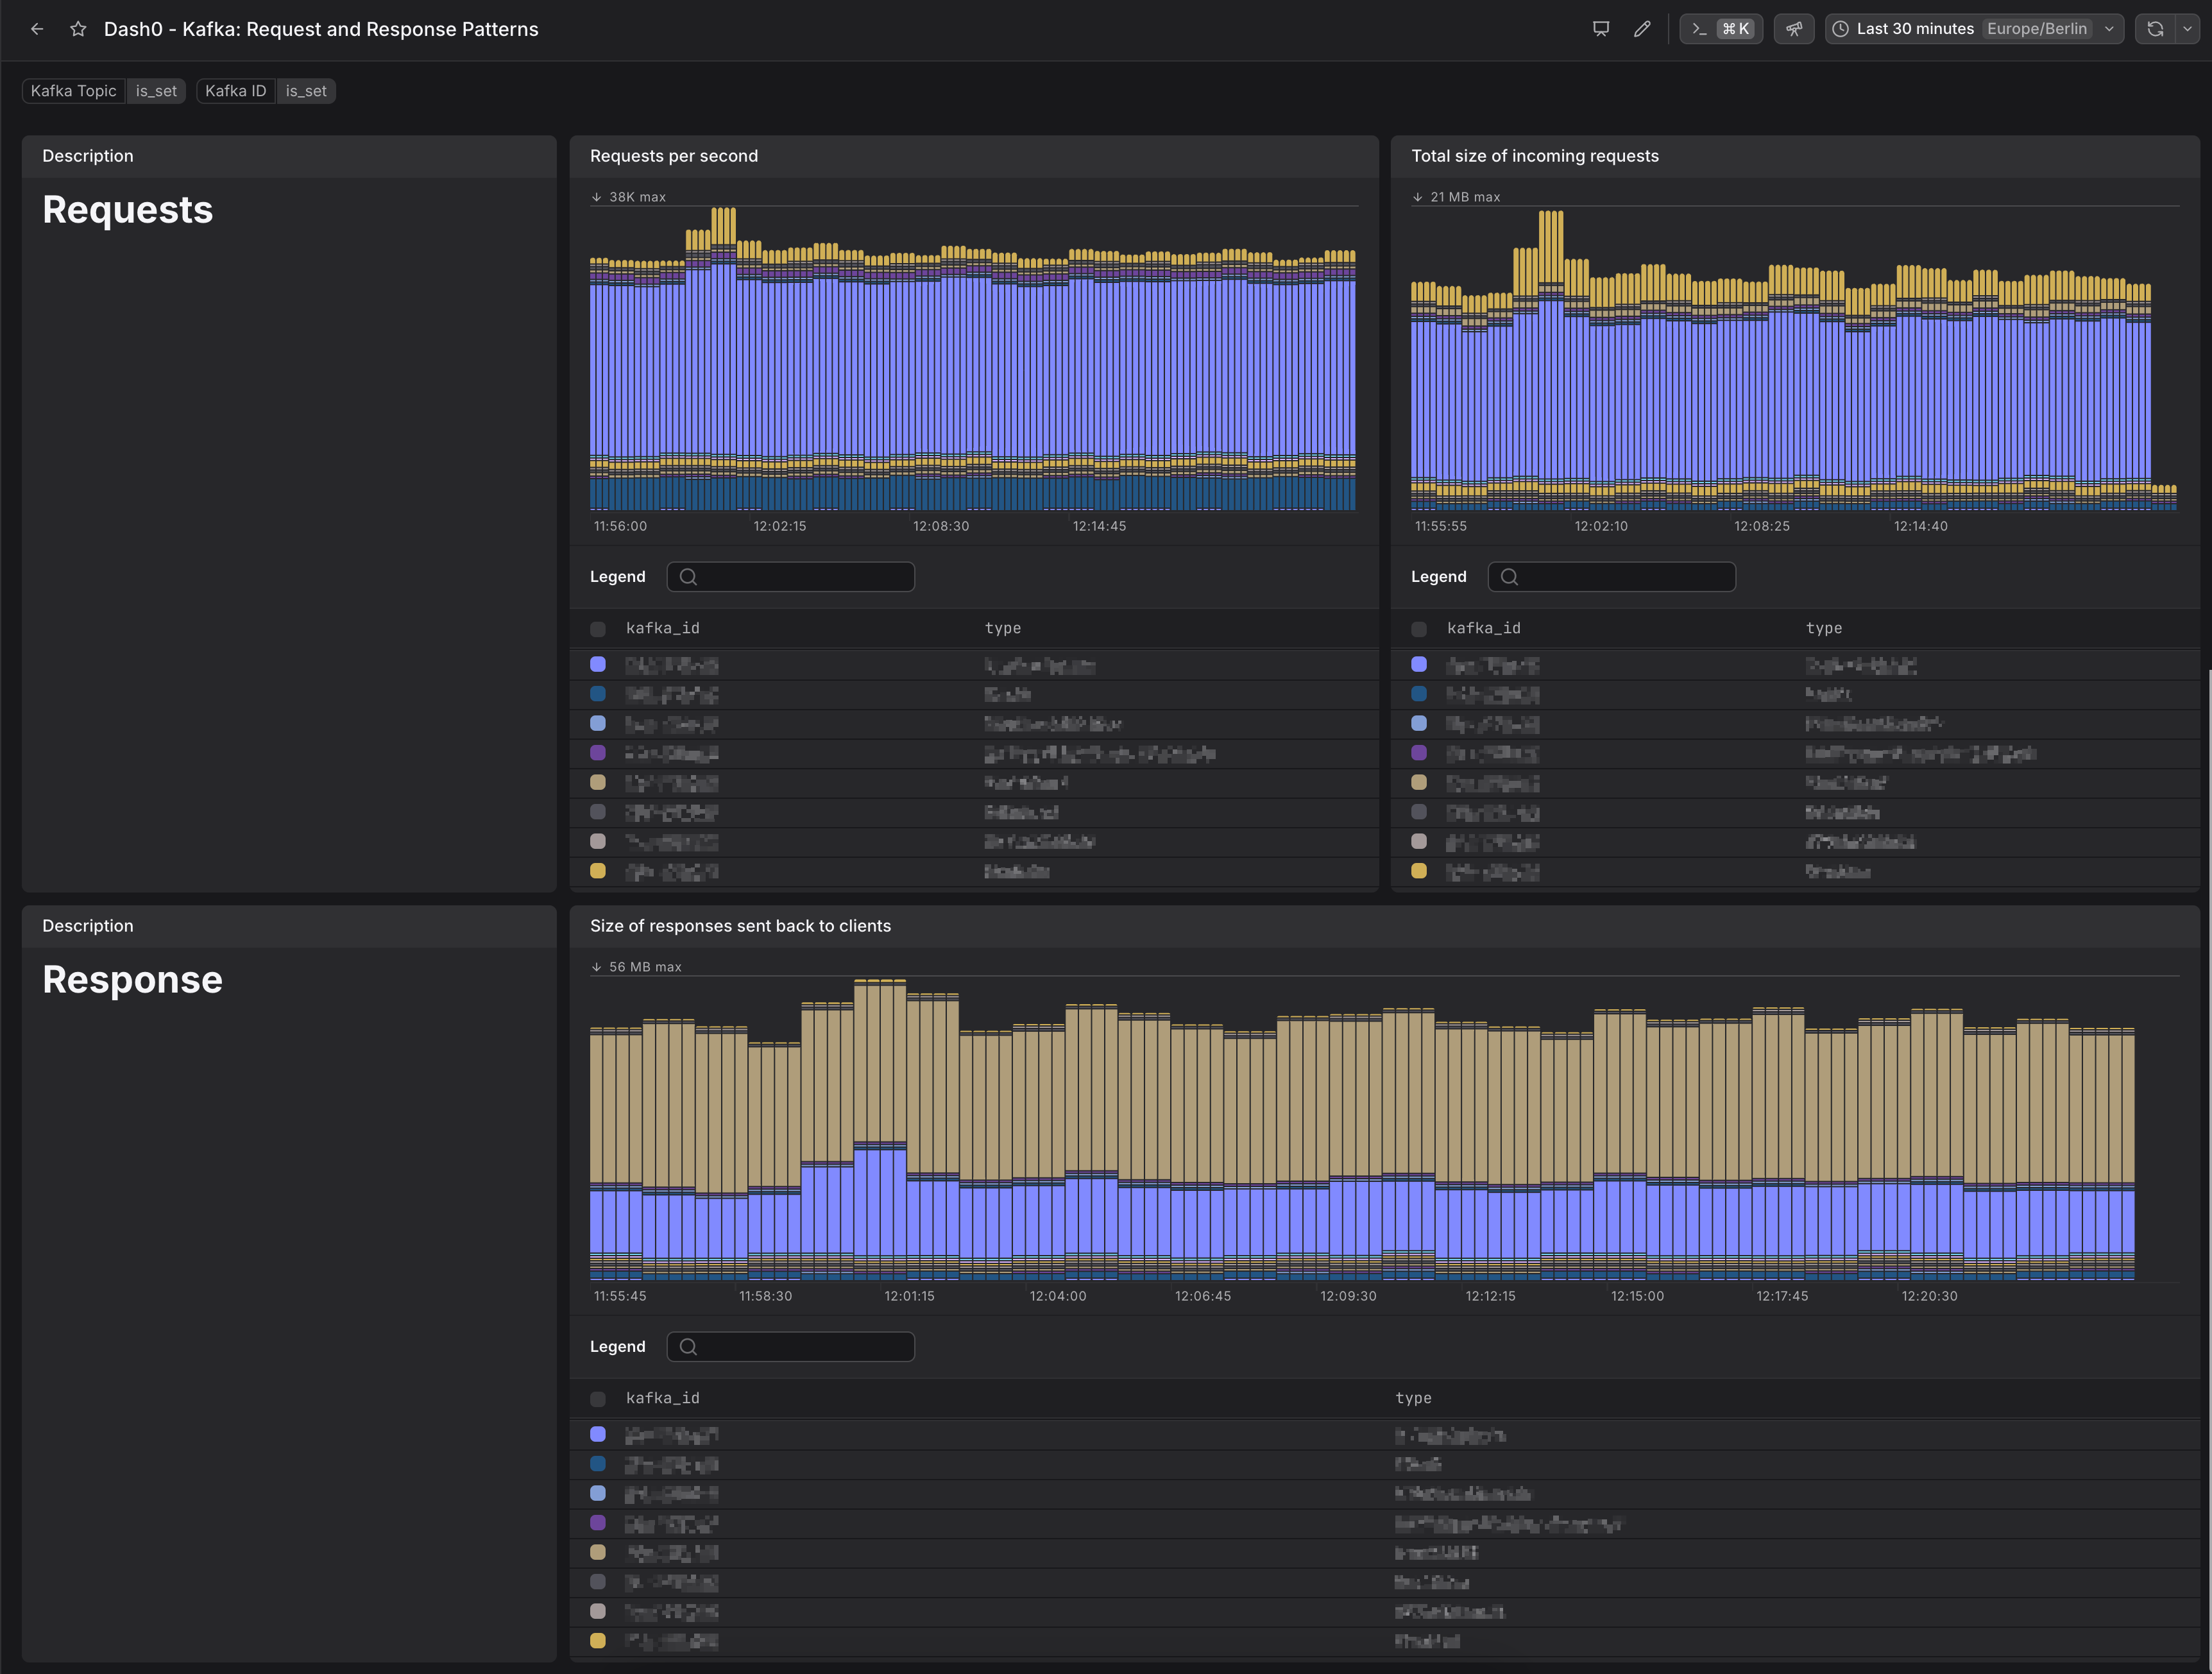
Confluent Kafka - Request and Response Patterns
Confluent Cloud exposes metrics through a Prometheus endpoint that you can scrape. We recommend to scrape and forward these metrics via an OpenTelemetry Collector.
To start, get a hold of your exporter key and secret. The Confluent Cloud documentation explains how to access these.
Once available, store these. In the next step, we will assume that these are exposed through environment variables called
CONFLUENT_METRICS_EXPORTER_KEY and CONFLUENT_METRICS_EXPORTER_SECRET respectively. We also recommend to define
the name of the environment within an environment variable called ENVIRONMENT_NAME.
The following code snippet shows an OpenTelemetry Collector configuration file.
The OpenTelemetry Collector pipeline visualized in OTelBin
Learn how to deploy the collector within our OpenTelemetry collector integration documentation.