
As modern systems move toward microservices, async messaging, and managed infrastructure, understanding a single request often means following it across many services, queues, and external APIs. That’s why distributed tracing has moved from a niche debugging technique to a core operational requirement.
Logs and metrics still matter, but neither explains why a specific request was slow or where an error actually originated. Traces fill that gap by connecting execution across boundaries and time.
This article focuses exclusively on open source distributed tracing tools. Every tool in the main list can be self-hosted, audited, and extended. Some are full observability platforms, others are purpose-built tracing backends, and a few sit somewhere in between.
While some of these projects also offer hosted or managed cloud versions, the assumption throughout is that you’re evaluating and running the self-hosted open source editions.
Open source distributed tracing tools comparison
| Tool | Category | OpenTelemetry support | Best at | Trade-offs |
|---|---|---|---|---|
| Jaeger | Tracing backend | OpenTelemetry compatible | Classic trace visualization | Manual analysis, aging UX |
| Grafana Tempo | Trace storage | OpenTelemetry compatible | Low-cost, large-scale trace retention | Metrics-led workflows, limited ad hoc search |
| Zipkin | Minimal tracing backend | OpenTelemetry compatible | Learning and small systems | Not suited for scale |
| SigNoz | OSS observability platform | OpenTelemetry native | Modern self-hosted tracing | Opinionated workflows, limited exploratory depth |
| Uptrace | OSS observability platform | OpenTelemetry native | Fast, contextual trace-led debugging | Fewer enterprise-oriented features |
| Apache SkyWalking | OSS APM platform | Partial OTel support | Automated service-centric tracing | Agent-first model, complex architecture |
| OpenObserve | OSS observability platform | OpenTelemetry-native | Unified logs, metrics, and traces | Query-first, not trace-first |
Below, each tool is broken down in more detail, with a focus on what it’s like to use once systems move beyond toy examples: how traces are explored, how quickly questions get answered, and where each tool starts to feel constraining.
1. Jaeger

Jaeger is one of the earliest widely adopted distributed tracing systems and remains a common reference point. Originally developed at Uber and now a CNCF project, it helped define how traces are collected, stored, and visualized in practice.
Jaeger focuses on being a reliable tracing backend. It collects spans, stores them in pluggable datastores, and presents traces through a familiar waterfall-style UI. OpenTelemetry exporters integrate cleanly, which makes Jaeger an easy destination for modern instrumentation pipelines.
What’s good
- Battle-tested and well understood in production
- Straightforward OpenTelemetry ingestion
- Simple deployment model with multiple storage backends
- Clear service dependency graphs
- Fully open source and self-hostable
The catch
Jaeger assumes a largely manual workflow. Trace exploration is limited, high-cardinality filtering is constrained, and correlating traces with logs or metrics requires external tooling. As traces grow larger and more complex, scrolling through waterfalls quickly becomes inefficient.
The verdict
Jaeger remains a solid baseline for distributed tracing. It works best as a reliable trace store rather than a primary investigation tool. Many teams start with Jaeger and eventually outgrow it once tracing becomes central to incident response.
2. Grafana Tempo

Grafana Tempo takes a deliberately minimal approach to distributed tracing. It’s designed to store very large volumes of traces cheaply and reliably, not to act as a primary trace exploration or debugging tool.
Tempo avoids indexing full trace payloads by default, which keeps storage costs low and lets it scale efficiently on object storage. That’s an intentional architectural choice. Tempo assumes investigations begin with metrics, usually in Prometheus, and that traces are pulled in later as concrete examples via exemplars.
What’s good
- Extremely scalable trace storage
- Predictable, low storage costs
- OpenTelemetry-compatible ingestion
- Tight integration with Grafana dashboards and Prometheus
- Simple operational model even at very high trace volumes
The catch
Tempo trades interactive query power for scalability by design. Ad hoc searching across span attributes is limited, and meaningful exploration often requires a known trace ID. As a result, tracing rarely leads investigations and instead plays a supporting role alongside metrics.
The verdict
Tempo works well when traces serve as durable context rather than the primary debugging surface. If your workflow expects to start from traces and explore them freely, Tempo will feel like the wrong abstraction.
3. Zipkin

Zipkin is one of the original open source distributed tracing systems. Its design is intentionally simple: collect spans, store them, and render basic timelines.
That simplicity makes Zipkin easy to understand and easy to run for small systems. It’s often used for learning, demos, or low-volume internal services.
What’s good
- Very simple mental model
- Easy to deploy and operate
- Fully open source and self-hosted
- Works well for small systems and experimentation
- Minimal infrastructure requirements
The catch
Zipkin hasn’t kept pace with modern tracing demands. High-cardinality querying, cross-signal correlation, and large-scale trace analysis are limited.
The verdict
Zipkin is best viewed as an educational or entry-level tracing backend. It’s useful for learning how tracing works, but most production systems outgrow it quickly.
4. SigNoz

SigNoz is an open source observability platform built on OpenTelemetry from day one. Traces, metrics, and logs share a unified data model and context, which helps engineers investigate issues without losing continuity between signals.
You can search and filter traces by span attributes, explore service dependency maps, analyze latency breakdowns, and pivot directly to related logs. The platform is opinionated toward application-level debugging rather than infrastructure-first monitoring.
What’s good
- OpenTelemetry-native ingestion and storage
- Unified traces, logs, and metrics with shared context
- Strong trace search and service-level views
- Clear latency and dependency visualizations
- Designed around application debugging workflows
The catch
SigNoz optimizes for common debugging paths rather than unbounded exploration. As trace volume and cardinality grow, deeply ad hoc analysis across many dimensions can feel slower and more constrained than in tools built explicitly for exploratory trace analytics.
The verdict
SigNoz is a strong option for teams that want a fully open source, OpenTelemetry-first APM focused on application behavior. It offers a cohesive and modern tracing experience, with the trade-off of more opinionated workflows.
5. Uptrace

Uptrace is an open source APM and observability platform, not just a tracing backend. It brings distributed traces, metrics, and logs into a single system, built natively on OpenTelemetry and backed by ClickHouse for fast analytical queries.
Uptrace is designed for teams that want to investigate incidents in one place without stitching together multiple tools. Traces are first-class and are meant to lead investigations, with metrics and logs providing immediate context.
What’s good
- OpenTelemetry-native ingestion for traces, metrics, and logs
- Trace-led debugging with fast, high-cardinality queries
- Unified investigation workflow across signals
- Built-in dashboards, querying, and alerting
- Efficient ClickHouse-backed storage
The catch
Uptrace focuses on engineering workflows rather than enterprise governance. Features like advanced RBAC, compliance tooling, or large-scale organizational controls are intentionally minimal compared to enterprise APM platforms.
The verdict
Uptrace is a strong fit for teams that want fast, contextual debugging in an OpenTelemetry-first system they can run themselves. It goes beyond tracing-only tools by making cross-signal correlation a default workflow rather than an afterthought.
6. Apache SkyWalking

SkyWalking is a full open source APM platform with a strong emphasis on automatic instrumentation and service topology. Traces primarily feed aggregated views rather than serving as the main exploration surface.
SkyWalking focuses on showing how services interact and where time is spent at a system level.
What’s good
- Automatic service discovery and tracing
- Strong dependency and topology views
- Well suited for large, dynamic environments
- Integrated metrics and tracing
- Mature project with long-term adoption
The catch
SkyWalking remains agent-first in practice. While OpenTelemetry ingestion is supported, core workflows still center on SkyWalking’s own service model. Exploratory, high-cardinality trace analysis is limited.
The verdict
SkyWalking works best when automation and consistency matter more than raw trace exploration. It’s effective for service-centric monitoring but less flexible for deep, trace-led debugging.
7. OpenObserve

OpenObserve is an open source observability platform designed around unified ingestion and storage of logs, metrics, and traces. It uses OpenTelemetry natively and stores data in a columnar format optimized for analytical queries.
Tracing in OpenObserve is part of a broader query-first model. Traces, logs, and metrics are queried together rather than explored through a trace-specific UI.
What’s good
- Native OpenTelemetry ingestion across all signals
- Unified query model for traces, logs, and metrics
- Columnar storage optimized for analytics
- Open source and self-hostable
- Simple, modern architecture
The catch
OpenObserve isn’t trace-first. Visual trace exploration and advanced trace-specific workflows are less developed than in tracing-centric tools. Investigations often rely on querying rather than guided trace navigation.
The verdict
OpenObserve is compelling for teams that want unified observability with an open source foundation. It works best as an analytics-driven platform where tracing is one signal among many, not the primary debugging surface.
Dash0 is an OpenTelemetry-native alternative
Dash0 isn’t open source, but it’s built entirely on open standards. It uses OpenTelemetry end to end, from instrumentation to ingestion, with no proprietary agents, SDKs, or closed data models.
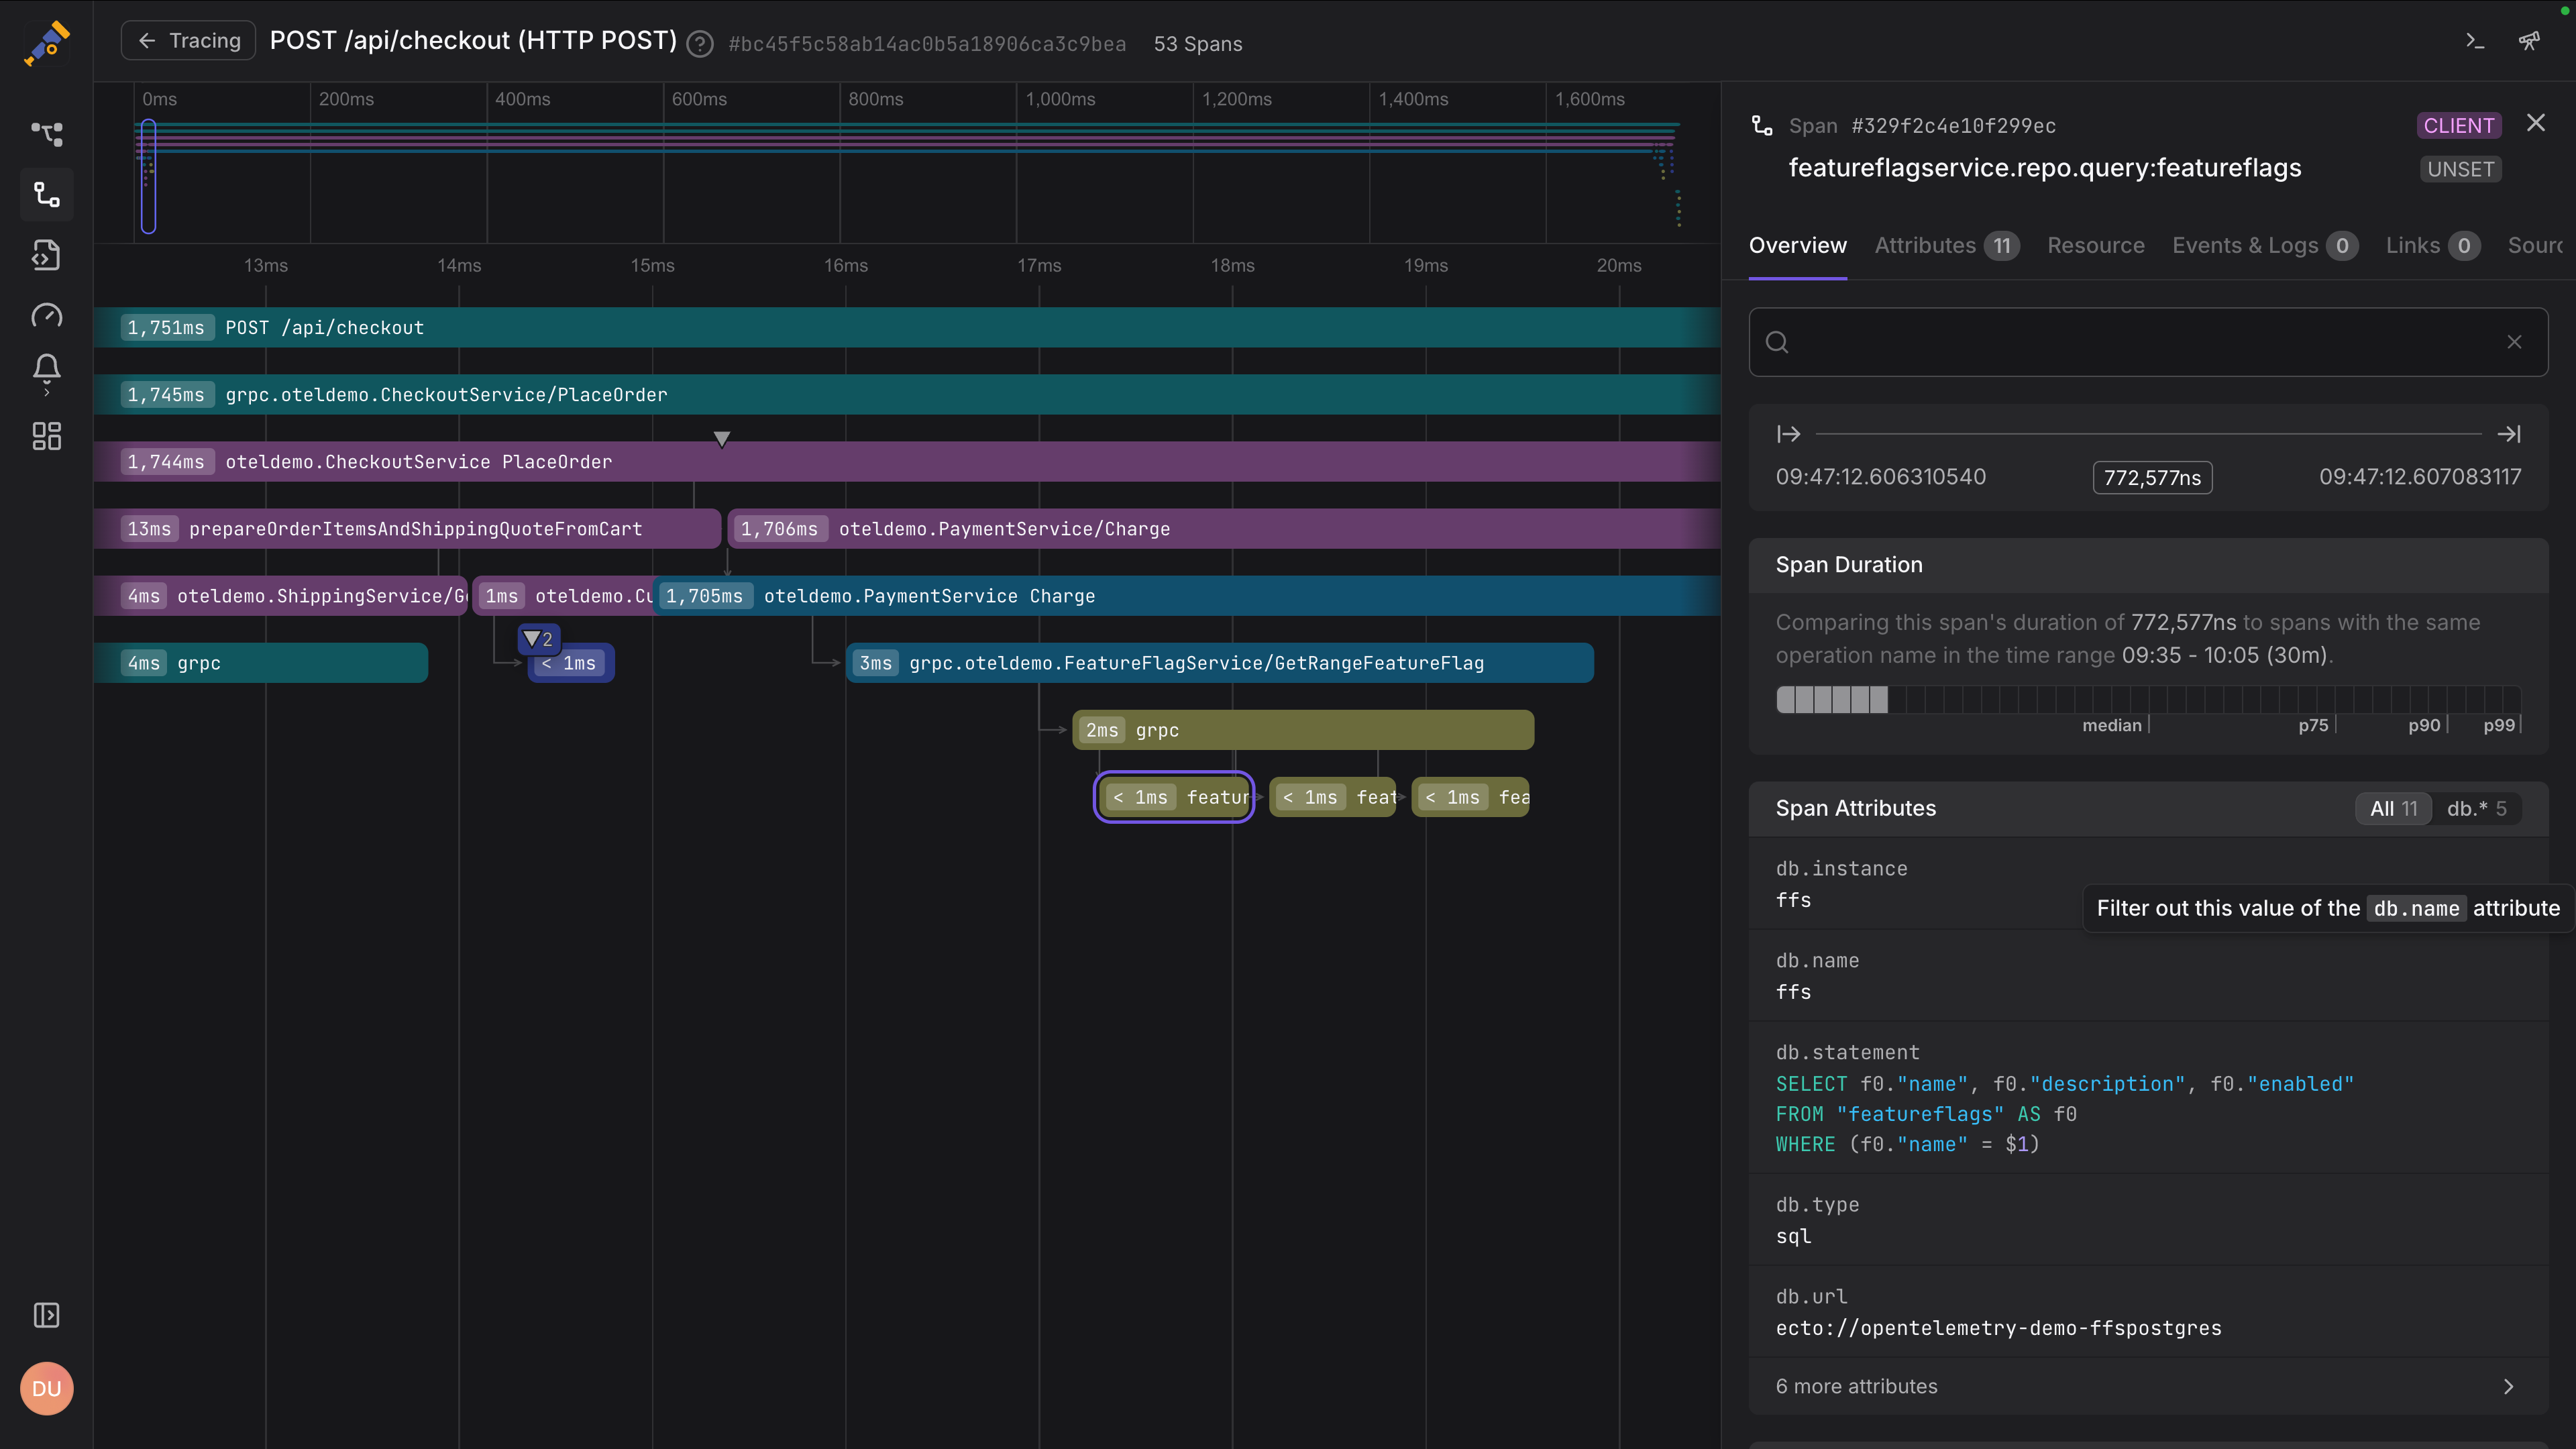
Dash0 treats distributed tracing as the primary investigation surface, not a secondary feature. Traces are explored at full fidelity, with high-cardinality search and built-in correlation to logs, metrics, resources, and recent changes. You start from a concrete request and expand outward only when it adds value.

To reduce the cognitive load of dense, multi-service traces, Dash0 can apply AI-based analysis directly to the tracing workflow. Its Threadweaver engine analyzes entire span graphs, highlights the spans and attributes that actually explain latency or errors, and surfaces clear causal relationships instead of forcing manual waterfall inspection.
For teams that want the flexibility of open instrumentation without running their own tracing backend, Dash0 offers a managed option that stays aligned with open standards and avoids vendor-specific telemetry lock-in.
Final thoughts
Distributed tracing instrumentation isn’t the hard part anymore. The real differences show up after ingestion, in how traces are explored, correlated, and understood when systems are under real production pressure.
Some tools optimize for low-cost storage, others for automation or topology mapping, and a smaller set prioritize deep, trace-led debugging. There’s no single best choice. The right tool depends on how central tracing is to your incident response and how much operational complexity your team wants to own.
What matters most is that traces stay rich, explorable, and tightly connected to real production context. When that breaks down, distributed tracing stops being a debugging tool and turns into just another dataset to manage.
If you want to keep the flexibility of open instrumentation without taking on the burden of running your own tracing backend, Dash0 offers a managed, OpenTelemetry-native alternative built for trace-led investigation.
Try Dash0 today and move from a failing request to its root cause in minutes instead of spending your time managing infrastructure.

